



The Dow Jones 30 and Nasdaq 100 remain under pressure and dropped significantly last week as the uncertainty in the Middle East, concerns about AI spending and high interest rates continue to pressure US stocks. The liquidity squeeze may also add further pressure on US stocks if the stock prices fail to recover above the key areas.
Trump Tariffs: Mexico Trade Talks Raise Hopes for US Stocks
President Donald Trump said that the US is very close to agreement with Mexico. He commented after the meeting with Mexican President Claudia Sheinbaum in Asia. The comments from President Trump increased the prospect of tariff relief but the agreement has not been announced yet.
As per the comments from Sheinbaum, the talks about vehicles, steel and aluminum have made progress. She mentioned that agreement can be made during the next meeting at G20 summit in December. The negotiations are important for companies that operate across North America. The drop in duties may reduce costs and make future orders easier to plan.
I think that the confirmed relief in tariffs may provide clear benefits to industrial sectors of Dow. The agreement may improve trade conditions and provide better costs for production.
There are fresh developments in exports during President Trump visit to Asia. The White House has mentioned that The Boeing Company (BA) and GE Aerospace have finalized $12 billion sale to Philippine Airlines for up to 20 Boeing 787 aircraft with GE engines. This announcement supports Boeing which is an important component of Dow.
Dow Jones Price Forecast
Every new Dow Jones analysis as it publishes, today's technical signal and key levels, live price — on one page.
See all Dow Jones forecastsWhy Dow Jones and Nasdaq Are Falling: AI Spending and Rate Risks
Inflation Expectations Ease as Rate Hike Risks Persist
The Fed minutes released on 18 November kept the risk of higher interest rates in near future. The market expects the Fed to increase the interest rate in December. But if the inflation outlook remains strong, the Fed may consider even larger rate hikes. Officials also discussed the risk of AI spending and rapid growth of related debt during the meeting.
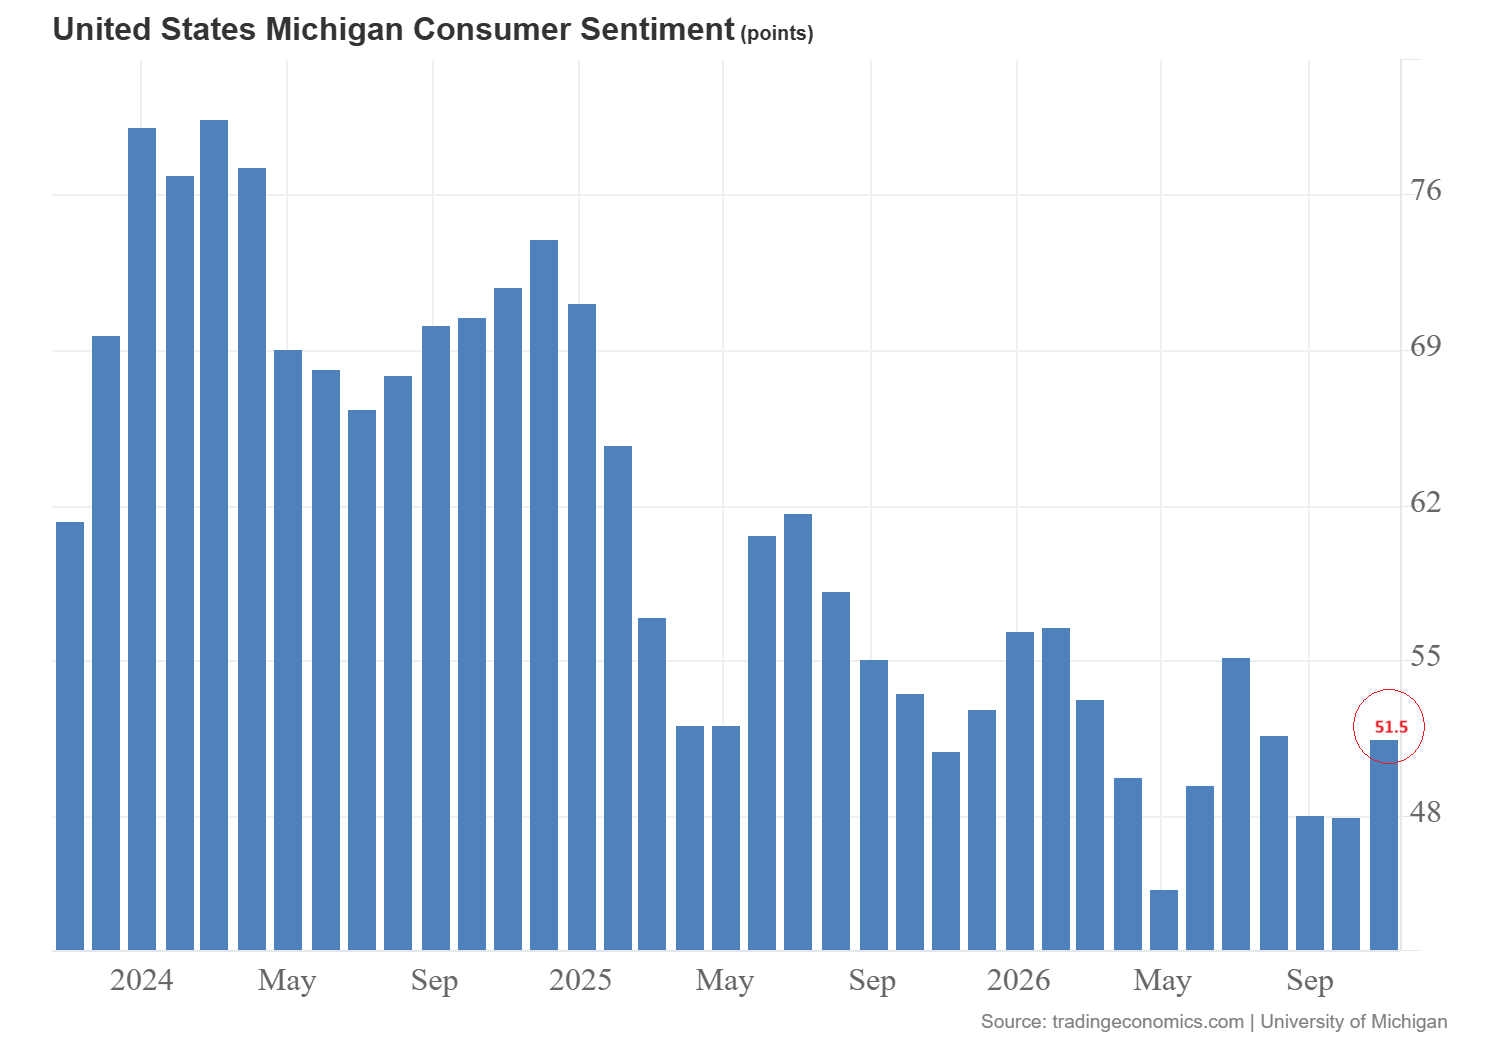
The final University of Michigan survey was released on Friday and offered some relief. The chart below shows that the consumer sentiment increased to 51.5 in November from 48.0 in October.
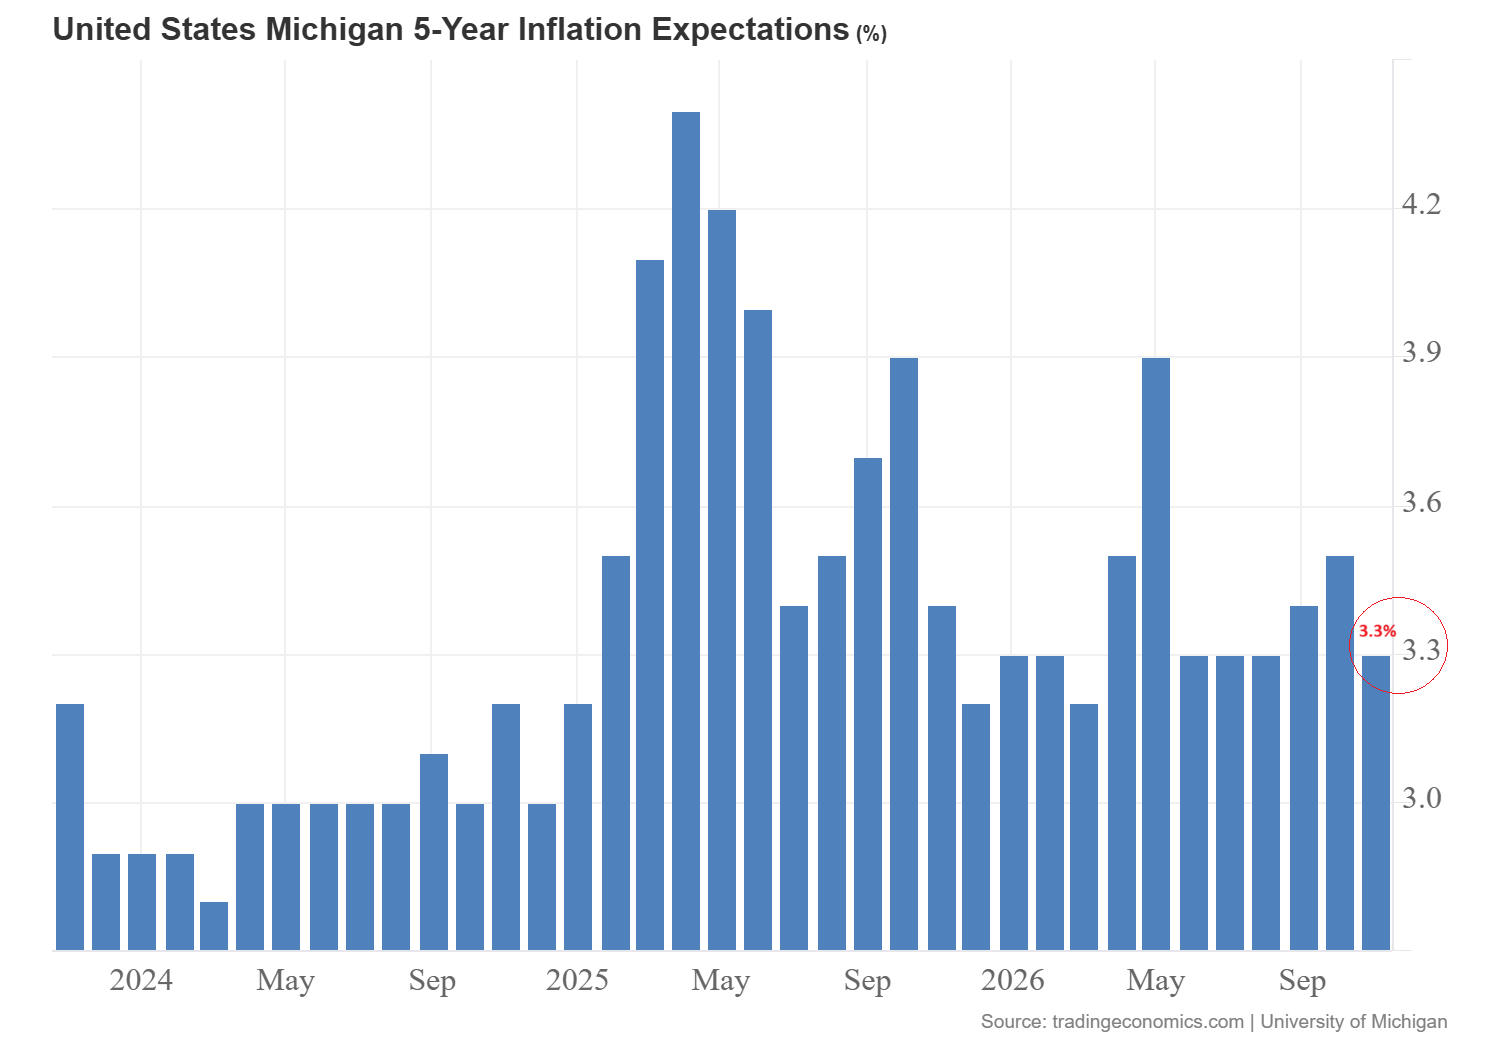
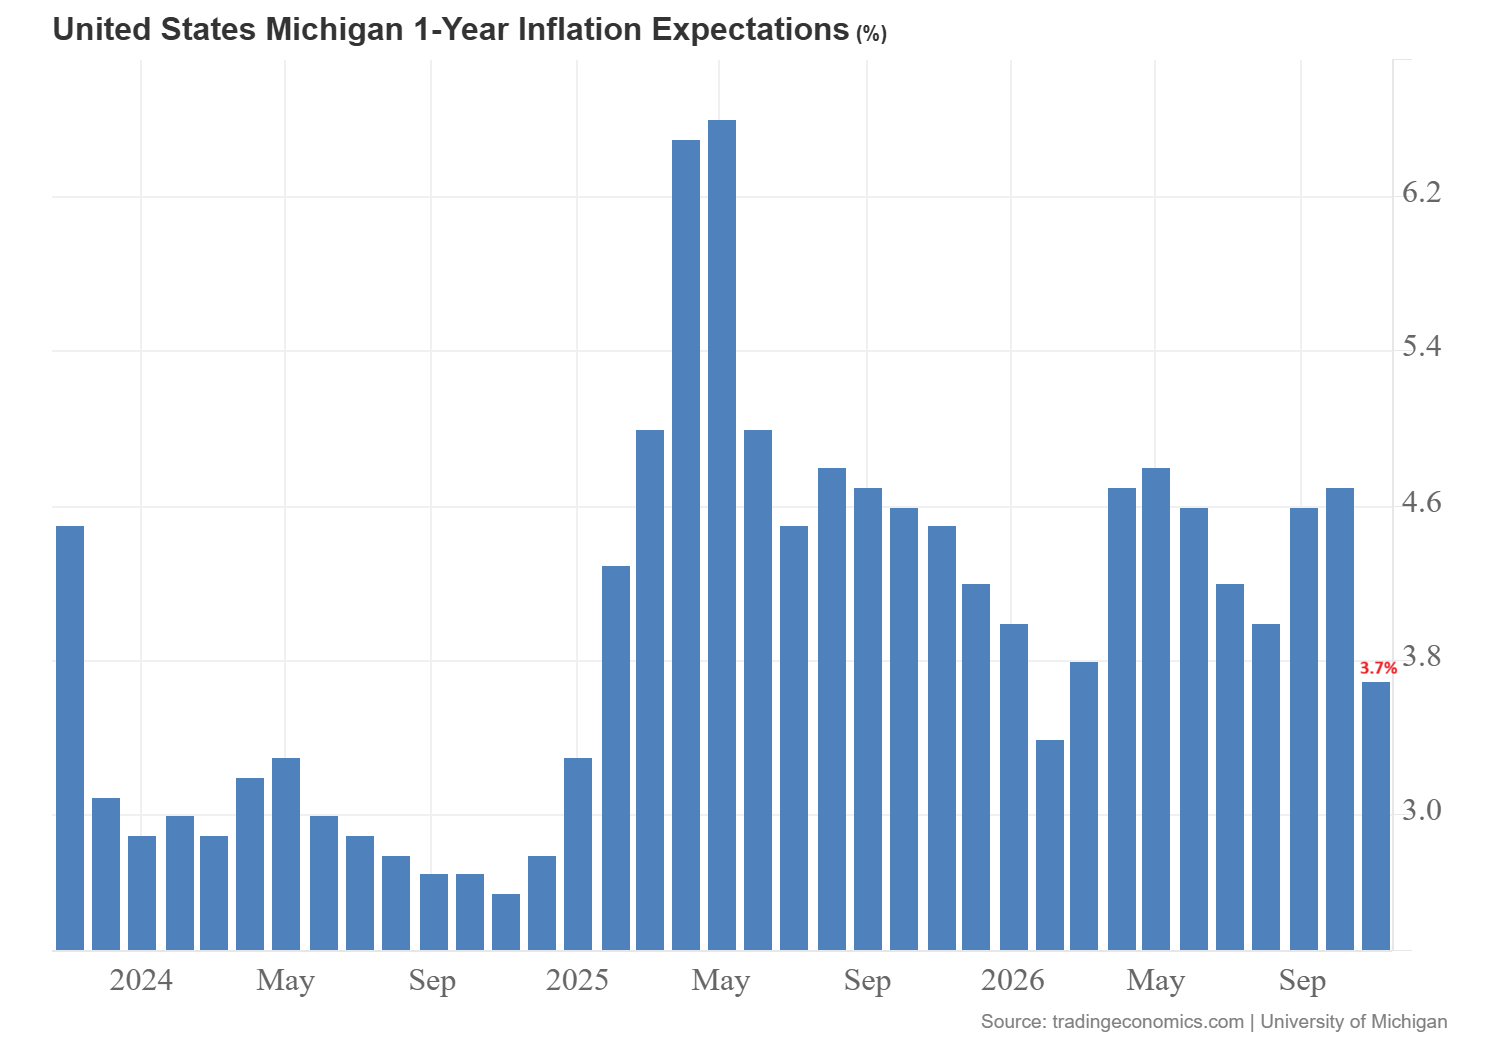
The one year inflation expectations dropped to 3.7% from 4.7% while the long-term expectations eased to 3.3% from 3.5%. The drop in inflation expectations may support confidence and reduce fears of persistent inflation pressure.
The US labour market also sends mixed messages. The chart below shows that the initial jobless claims increased by 1000 to 203,000. The continued claims increased by 70,000 to 1.763 million for the first week of November.
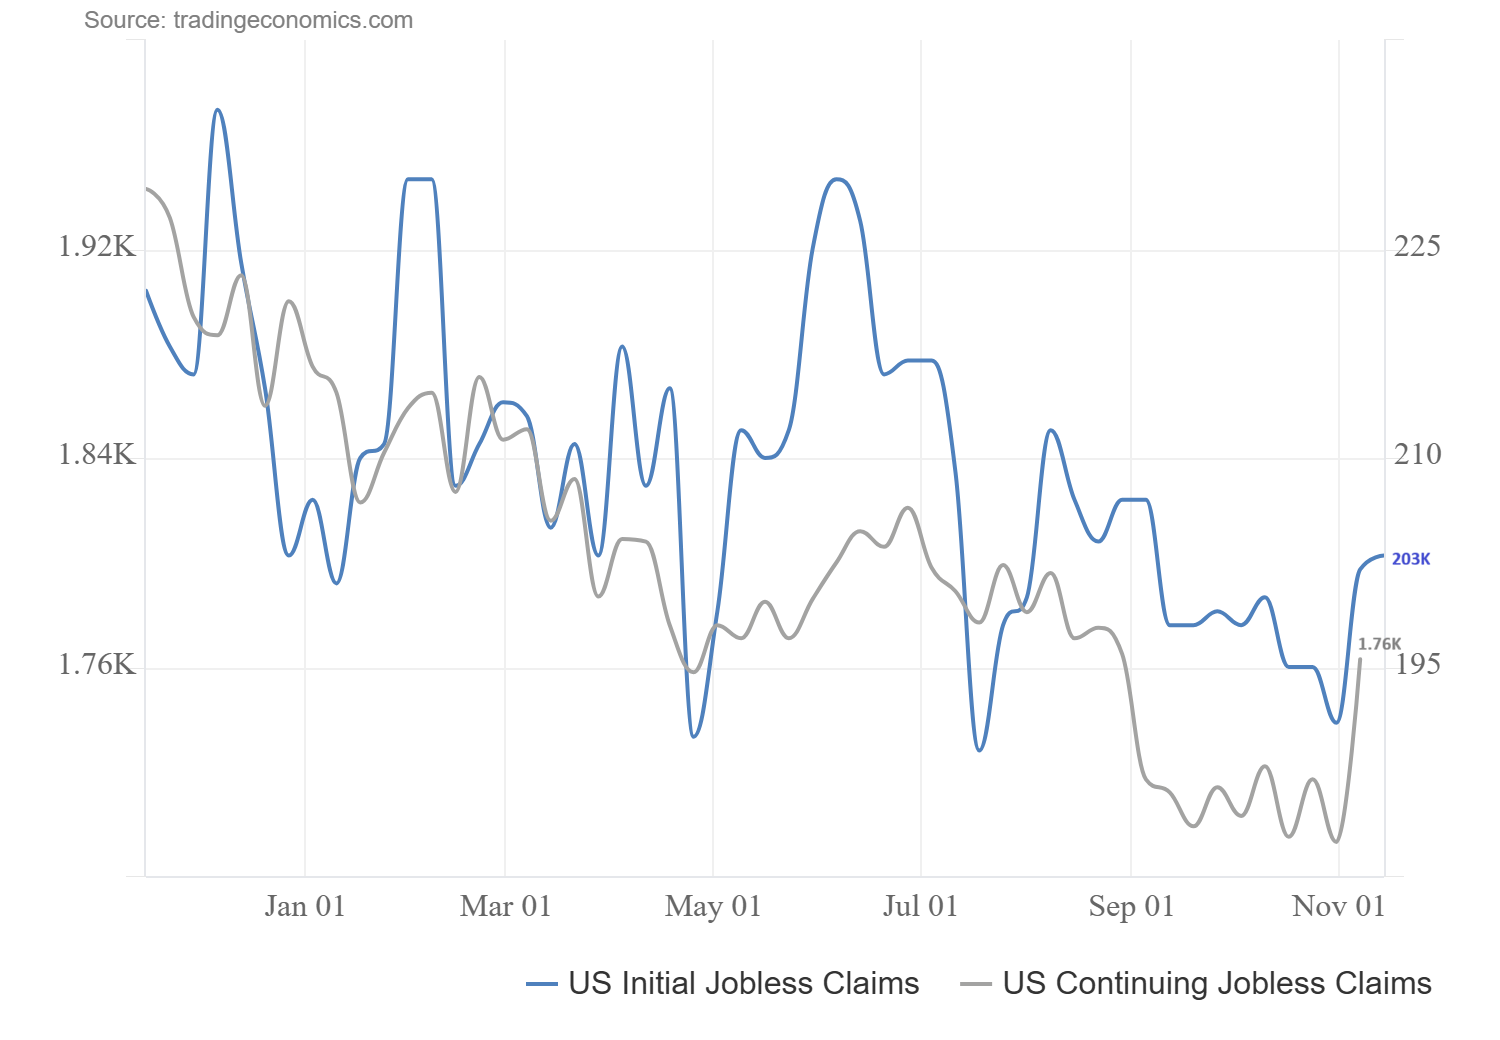
The initial claims do not show any sharp wave of layoffs but the rising continuing claims suggest that some workers face difficulty finding another job. The continuous increase may threaten the consumer spending and corporate sales.
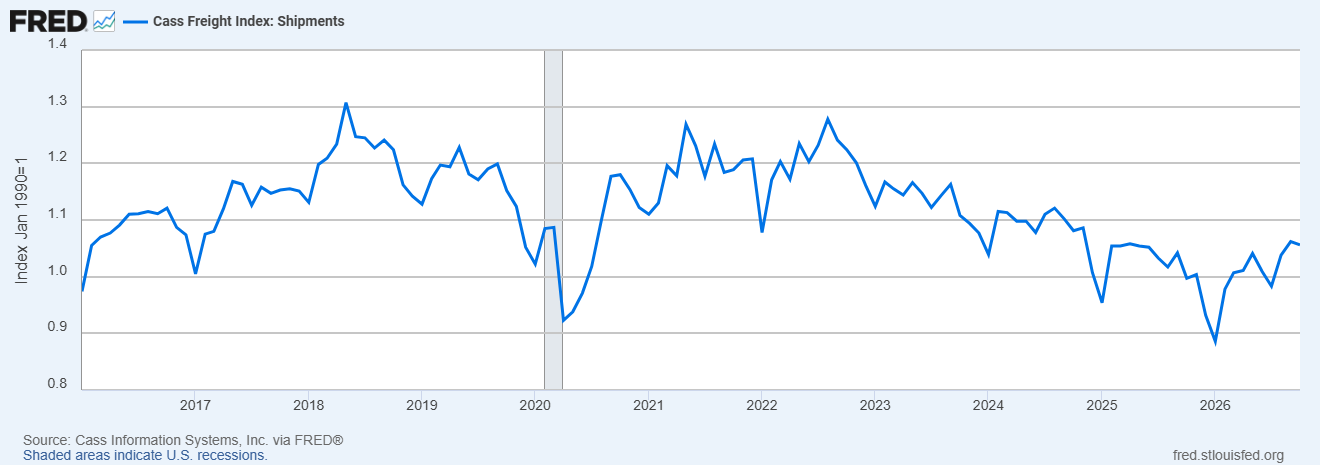
The chart below shows that freight shipments have increased recently but the average reading still remains below previous peaks. This suggests that the recovery needs time to strengthen. The recovery in this index may support confidence in industrial sales but the renewed weakness may increase concerns about corporate earnings.
Lower Treasury Yields Fail to Stop the AI Stock Selloff
US Treasury yields dropped lower last week after the strong spike to 5.17% following the US consumer inflation data. The 10-year US Treasury yield dropped to 4.91% on Friday.
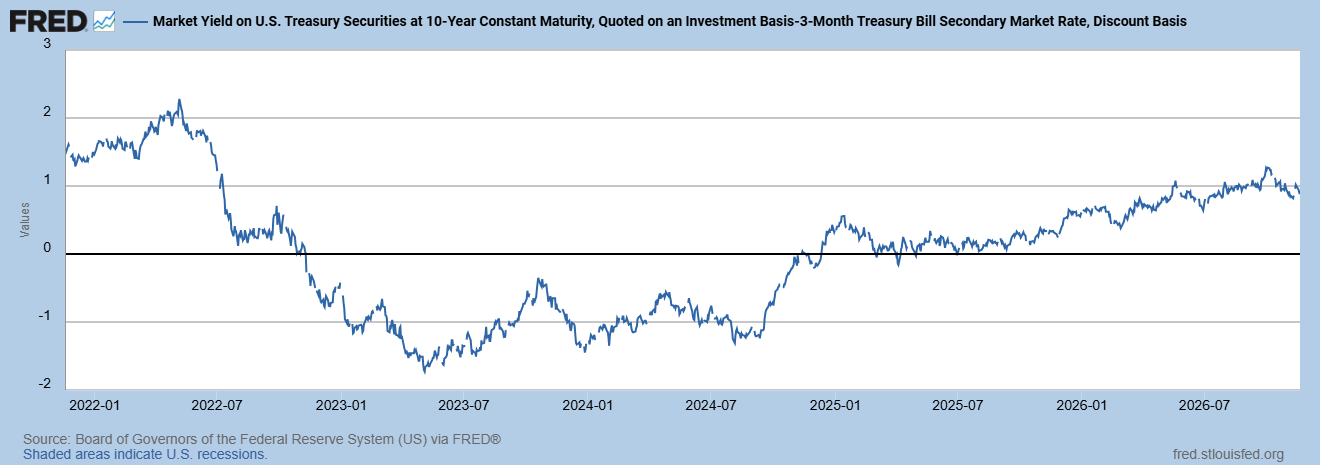
The yield curve provides the long term view of interest rates. The chart below shows that the 10-year Treasury yield lies at 0.96% above three-month bill rate. The spread has recovered from the earlier inversion. But the latest strength in curve does not guarantee strong growth. Investors still need to see whether falling yields reflect the easing of inflation or growing concerns about demand.
The drop in yields supports the valuations in technology stocks but the short-term momentum in technology stocks remains strongly bearish. I think that the concerns about the profitability from the AI spending outweigh the benefits of cheaper long term funding.
AI stocks continued to drop last week and lost heavily. Nvidia Corp. (NVDA) lost 13.8% while Anthropic dropped 9.1% in the second trading session. Caterpillar Inc. (CAT) dropped 5% as investors raised the concerns about demand for equipment used in power generation and backup systems. This suggests that the risk of slowdown in AI is now expanding beyond technology stocks and reaches the industrial companies that supply data center buildout.
Nasdaq 100 Forecast: Break Below 26,200 Puts 23,500 in Focus
The weekly chart for Nasdaq 100 shows that the index dropped significantly last week by 9.38% to close the week at 25,237.50. The index has broken the key support at 26,200. This breakdown suggests that the index may continue to drop towards 23,500.
This support is defined by ascending trend line that stretches from the highs of December 2025. A break below 23,500 may trigger deeper decline to the 200-week SMA near the 21,000 level.
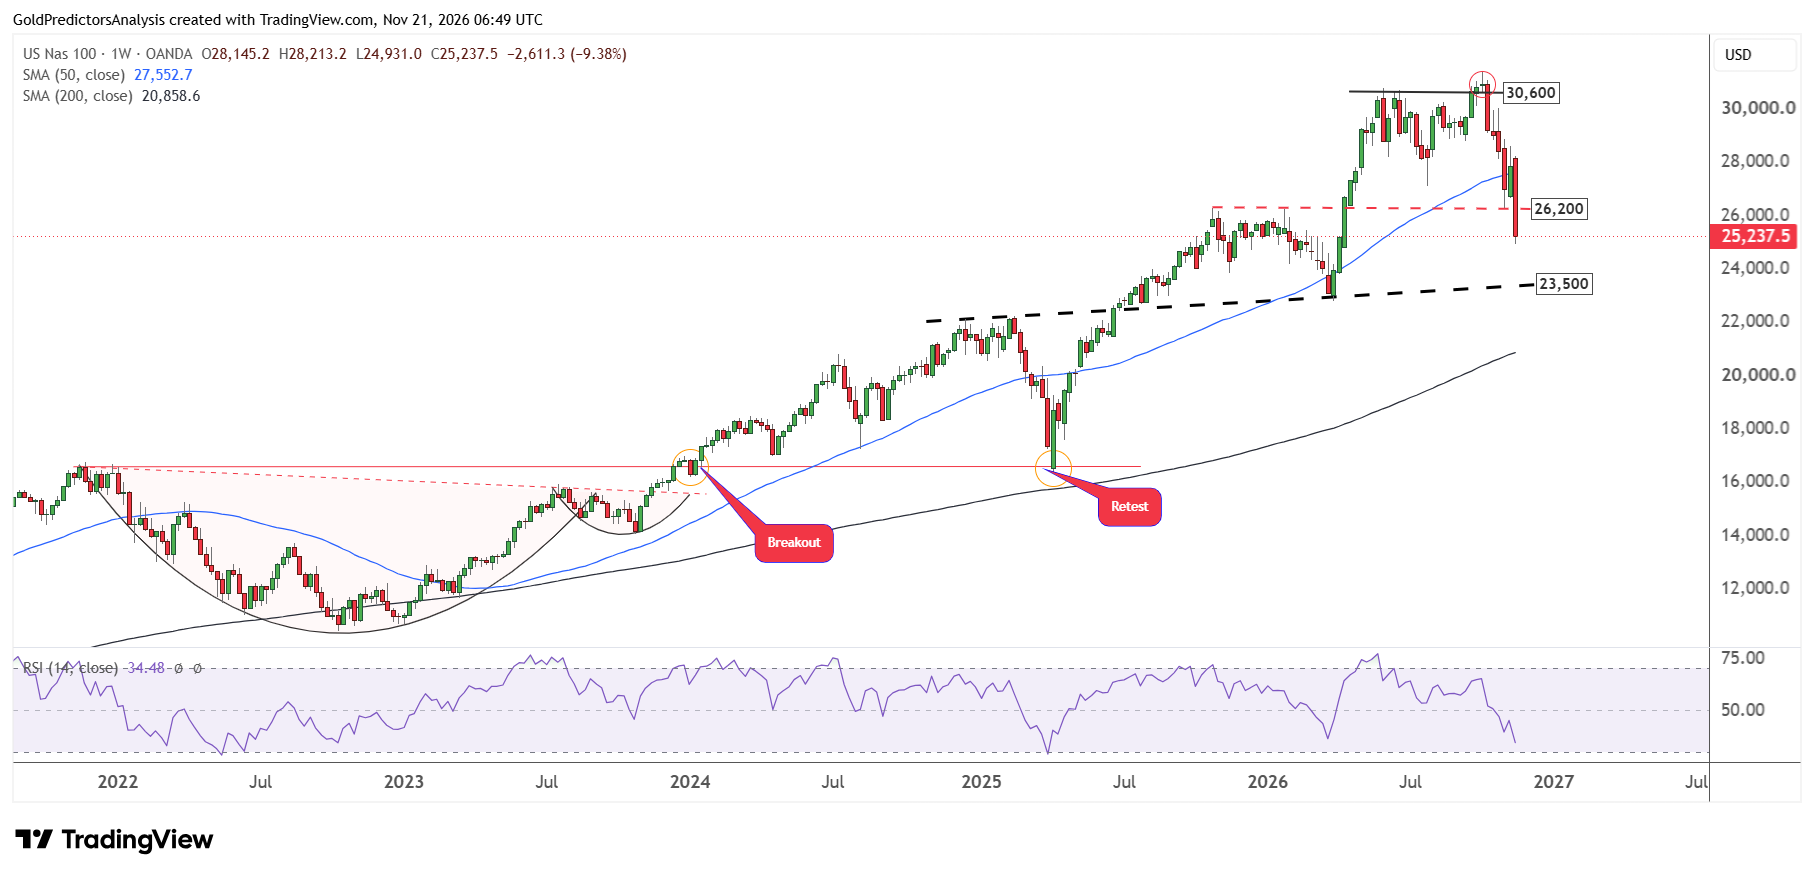
Despite the strong correction in stock market, the overall price structure remains strongly bullish. This bullish structure is seen in the cup and handle formation from November 2021 to November 2023. The RSI is also approaching oversold levels when the index drops towards the key support at 23,500.
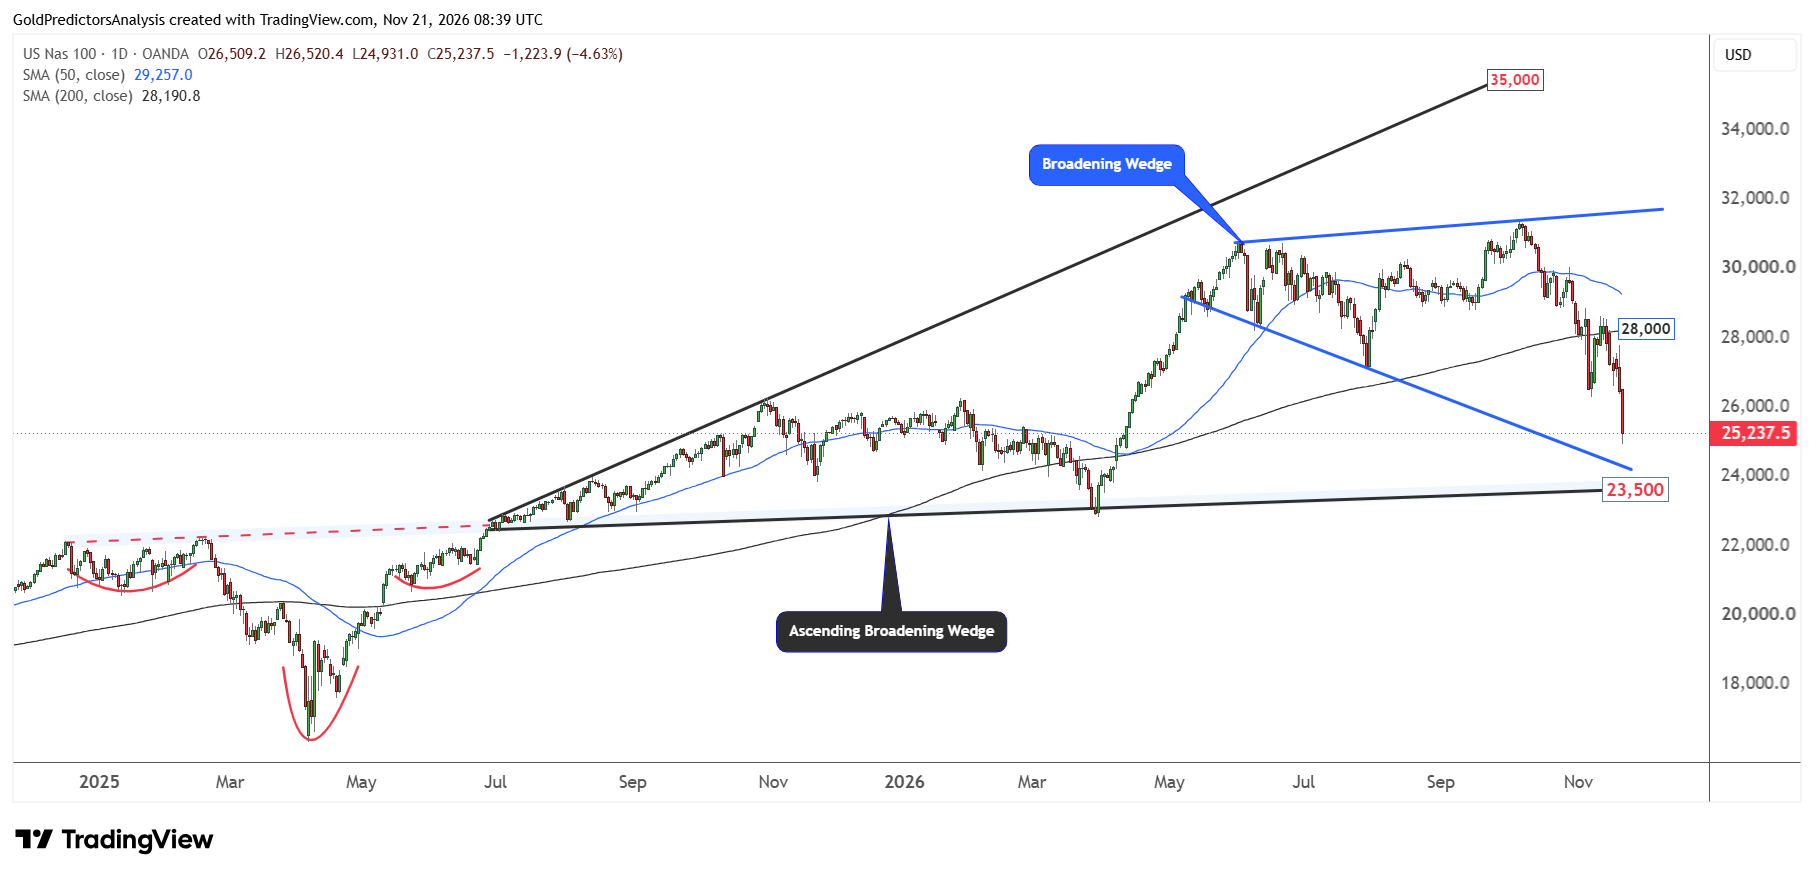
The importance of the key support at 23,500 is also seen on the daily chart. The daily chart shows the formation of broadening wedge pattern from June 2026. The index has broken the 200-day SMA at 28,000 and continues to drop significantly.
The index has dropped by 4.63% on Friday which suggests that the index may continue towards the lower boundary of broadening wedge near the 23,500 level. This support is also defined by the ascending broadening wedge pattern that stretches from June 2025.
The Nasdaq 100 may rebound and rally higher if this support level holds. The index must recover above the 28,000 level to initiate next rally.
Dow Jones Forecast: Break Below 50,000 Points Towards 45,000
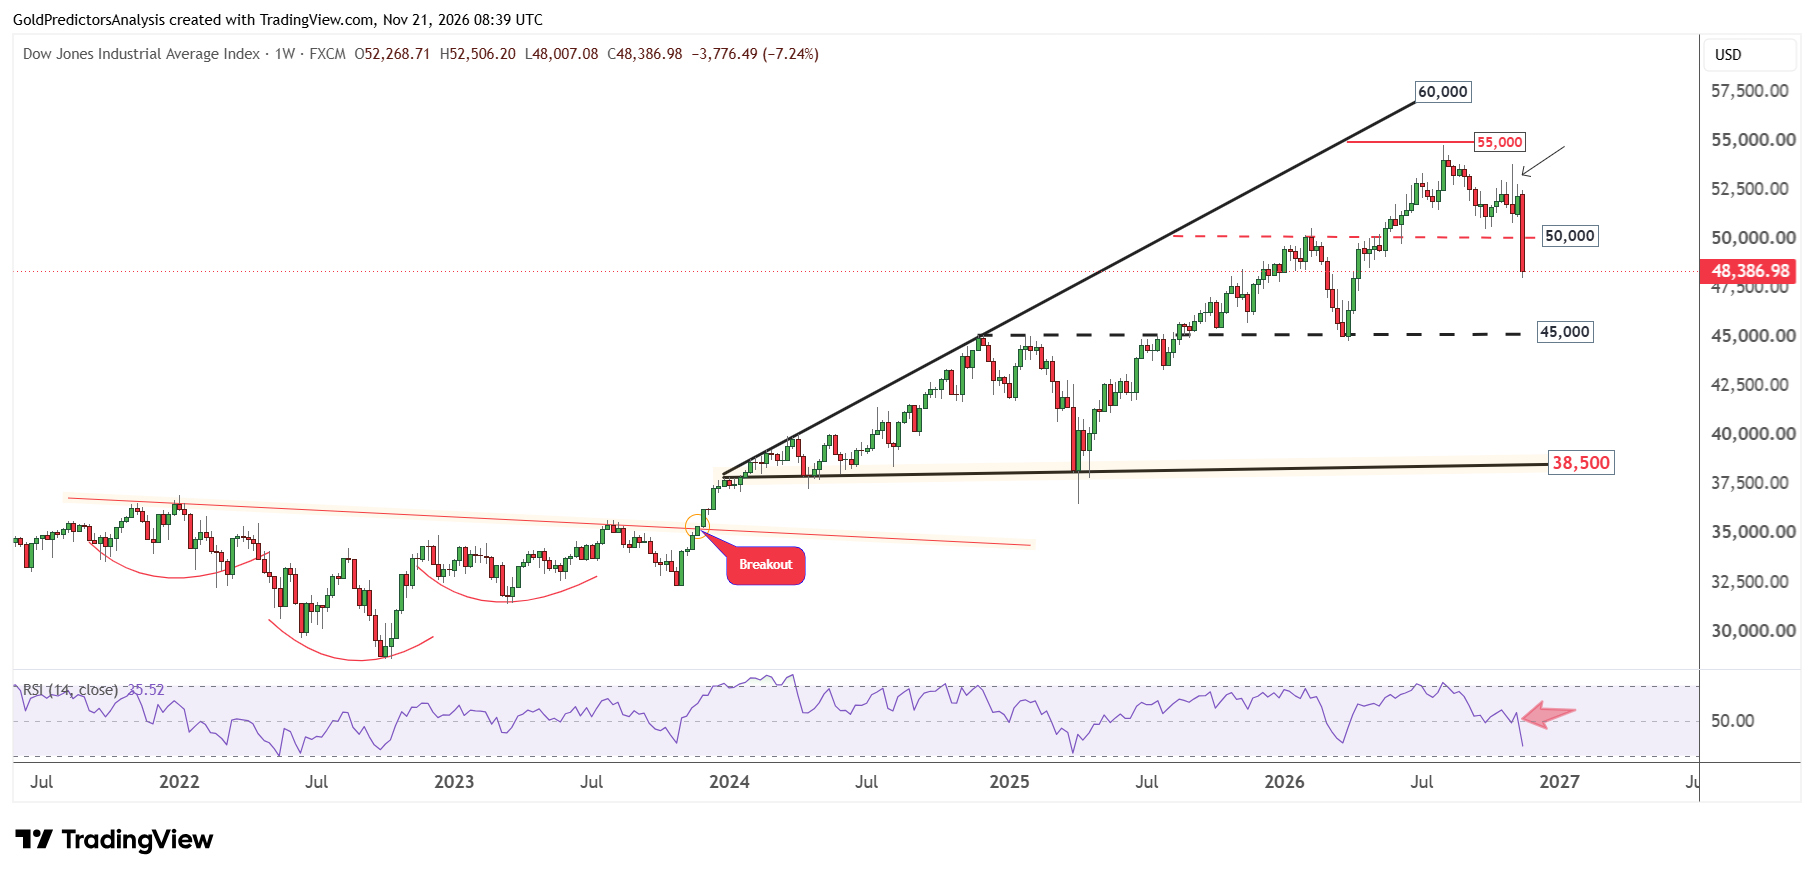
The weekly chart for the Dow Jones shows that the index broke below the key support at 50,000 last week and closed the week with the loss of 7.24%. This breakdown suggests that if the index remains below the 50,000 level, it may drop towards the 45,000 level.
A break below 45,000 may trigger deeper correction towards the 38,500 level. The long term support at 38,500 is defined by the ascending broadening wedge pattern that stretches from January 2024.
The RSI indicator also broke below the midline as the index broke the key support at 50,000. This increases the risk of further downside towards the target of 45,000.
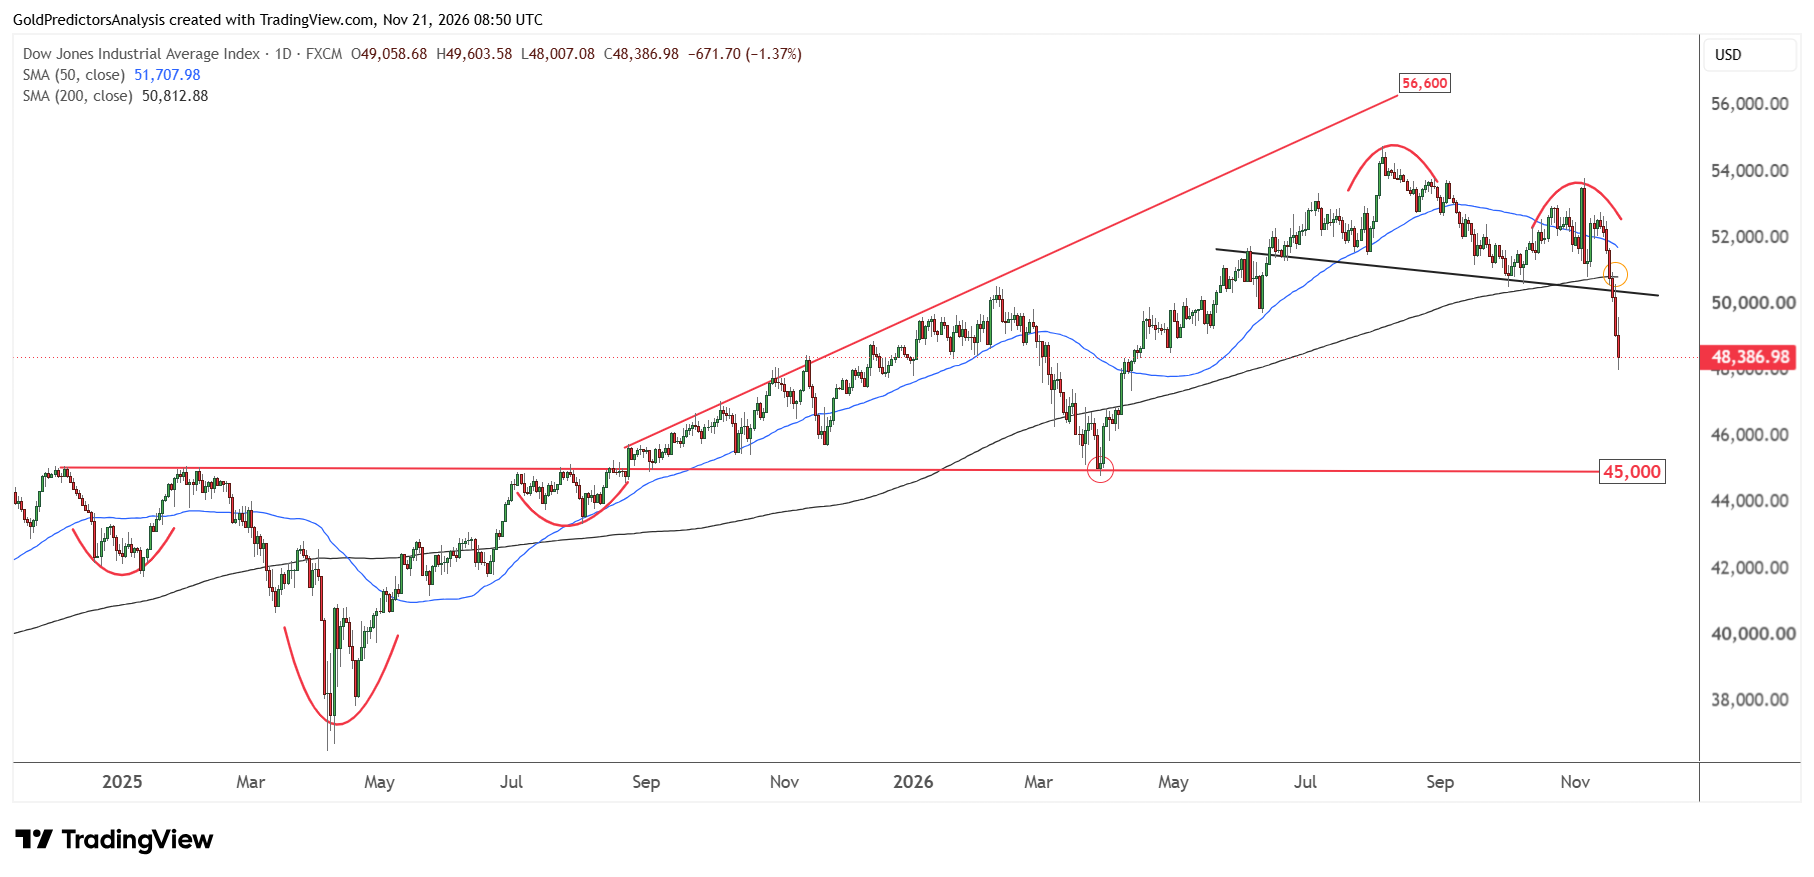
The importance of 45,000 is also seen on the daily chart which represents the neckline of the inverted head and shoulders pattern that formed from December 2024 to August 2025. The chart shows that the price remains under extreme pressure with significant resistance at the 50,000 level.
A break above 50,000 may open the way for further upside towards the 55,000 area. But a break below 48,000 may continue the momentum towards the 45,000 level.
Liquidity Risks and Key Levels to Watch
Iran may make the US blockade of Iranian ports as difficult as possible with the hope that the US will withdraw. The shipping flows through the Strait of Hormuz are shrinking, as seen in the chart below.
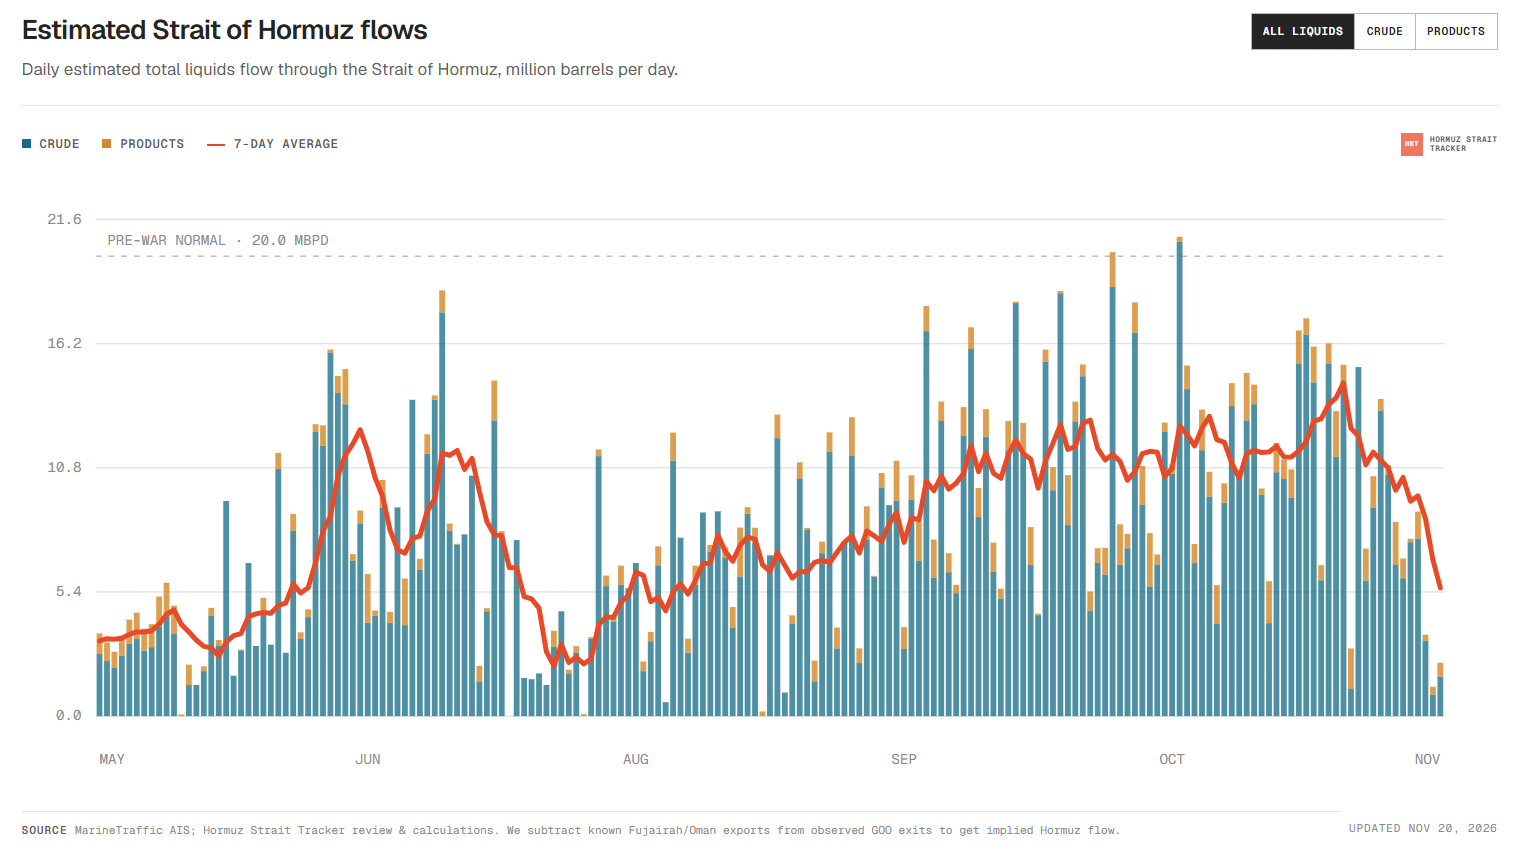
This may cause the liquidity event in Saudi Arabia and Persian Gulf states. The recent selloff in broader markets such as WTI oil, gold (XAU) and US stocks may be the symptom of shrinking liquidity. The 10-year Treasury yields dropped below 5% as money flows from stocks to relative safety of bonds.
The recent quick drop in the S&P 500 and Nasdaq 100 is followed by the recent drop in US Treasury yields to 4.91%. This drop may reduce the expectations for further rate hikes.
As per the above analysis, the Nasdaq 100 and Dow Jones remain under extreme pressure in the short term and concerns about AI spending weigh on confidence. The correction in inflation data may offer some relief but the lasting recovery needs strong confidence in corporate profits and returns from AI investment.
The Nasdaq 100 broke the support of 26,200 and is looking for a decline to 23,500. A break below this level may offer deeper decline to 21,000. Nasdaq 100 must recovery above 28,000 to strengthen the case for a rebound.
The Dow Jones also remains under pressure as the index broke the key support of 50,000. A break below 48,000 will suggest a drop to 45,000. If the Dow Jones fails to hold 45,000, it may drop towards 38,500. The Dow Jones must recover above 50,000 to suggest the recovery.
Read more: AI Stock Selloff Pressures S&P 500