


Gold (XAU) price dropped 2.76% on Thursday to hit the 13-month low and triggered a rebound in early Asian trading on Friday. Silver (XAG) price also dropped over 3% on Thursday and traded near $50. Oil prices rebounded on Thursday as President Trump mentioned that there is no need for a deal with Iran. These comments increased concerns about supply in the Middle East. Higher oil prices increased inflation concerns after the hot inflation data on Tuesday.
The US dollar index and US Treasury yields continue to rally after the hot inflation data. The 10-year US Treasury yield has increased to 5.10% while the US dollar index has reached the 102.30 level on Friday. The US dollar is currently trading near the 19-month high, which adds pressure to gold and silver prices.
The market expects an 89% chance of 25 basis points hike in December. The hot inflation readings may increase expectations of larger rate hikes and strengthen the US dollar and US Treasury yields. This may push gold prices below $3,800 and silver prices below $50.
Gold Price Forecast: Bearish Pressure at a 13-Month Low
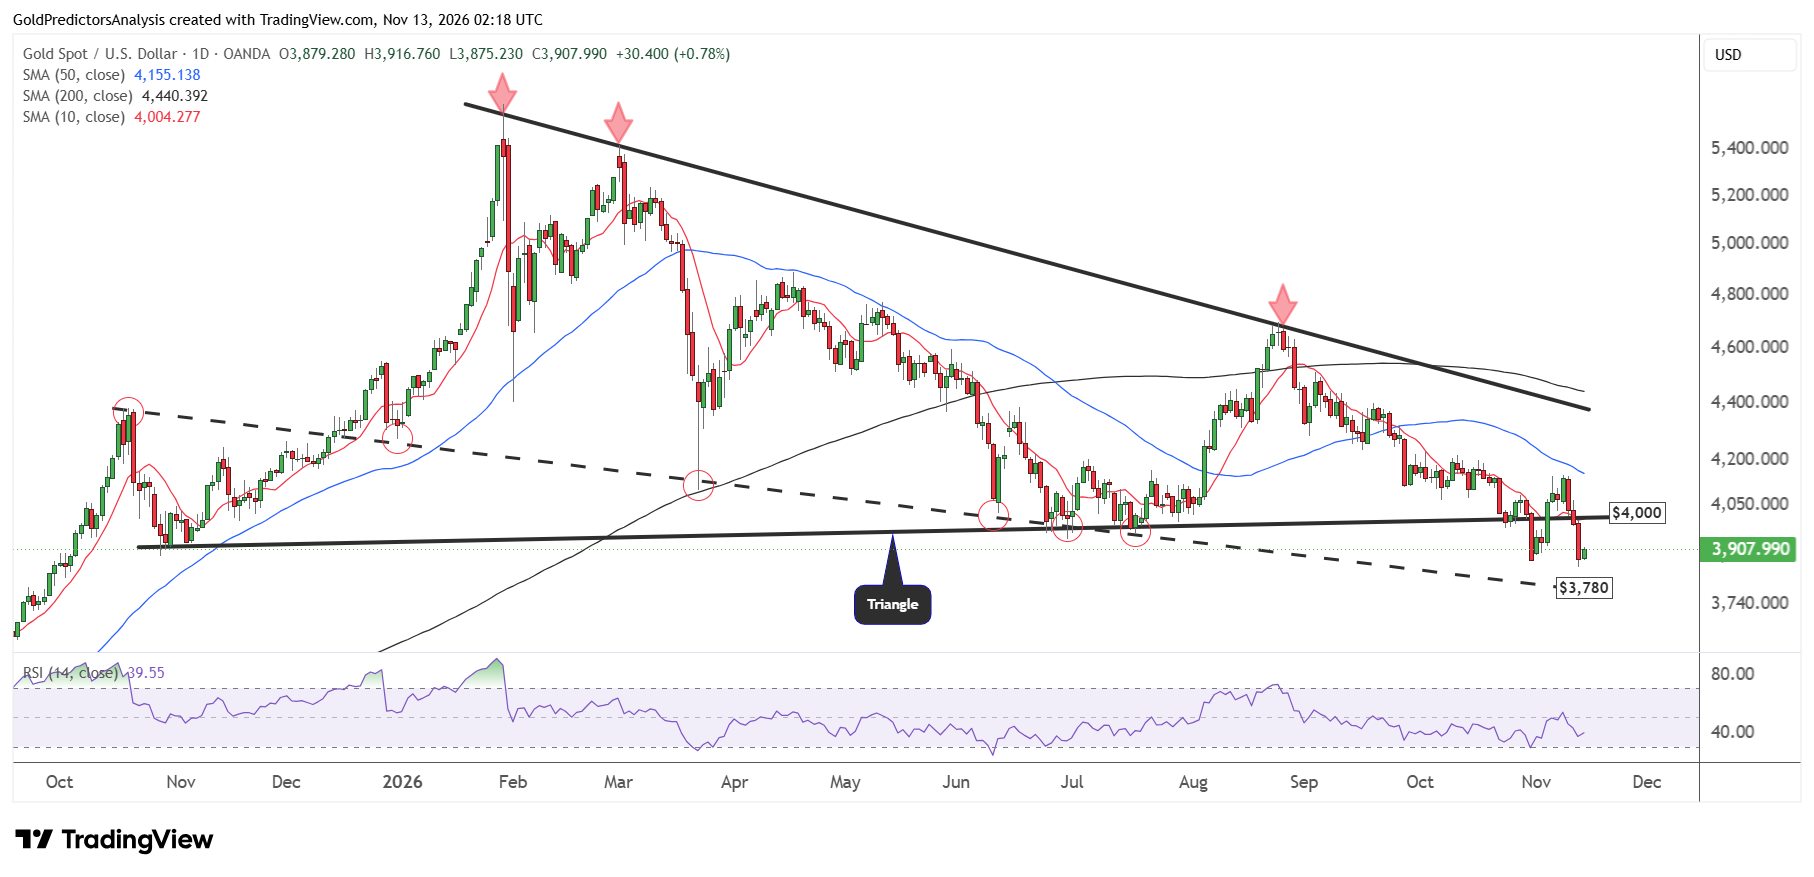
The daily chart for spot gold shows that the price continues to drop after the break from the triangle pattern. The price dropped by 2.76% on Thursday and rebounded on Friday. The market is now waiting for the US PPI data to find some clues about the next direction in gold.
The strong inflation data from US may push gold prices further down towards the next support zones. The RSI also remains below the midline which suggests that the trend in gold remains negative in the short term. The price needs to recover above $4,000 and $4,150 to open the way for further upside towards the $4,400 area.
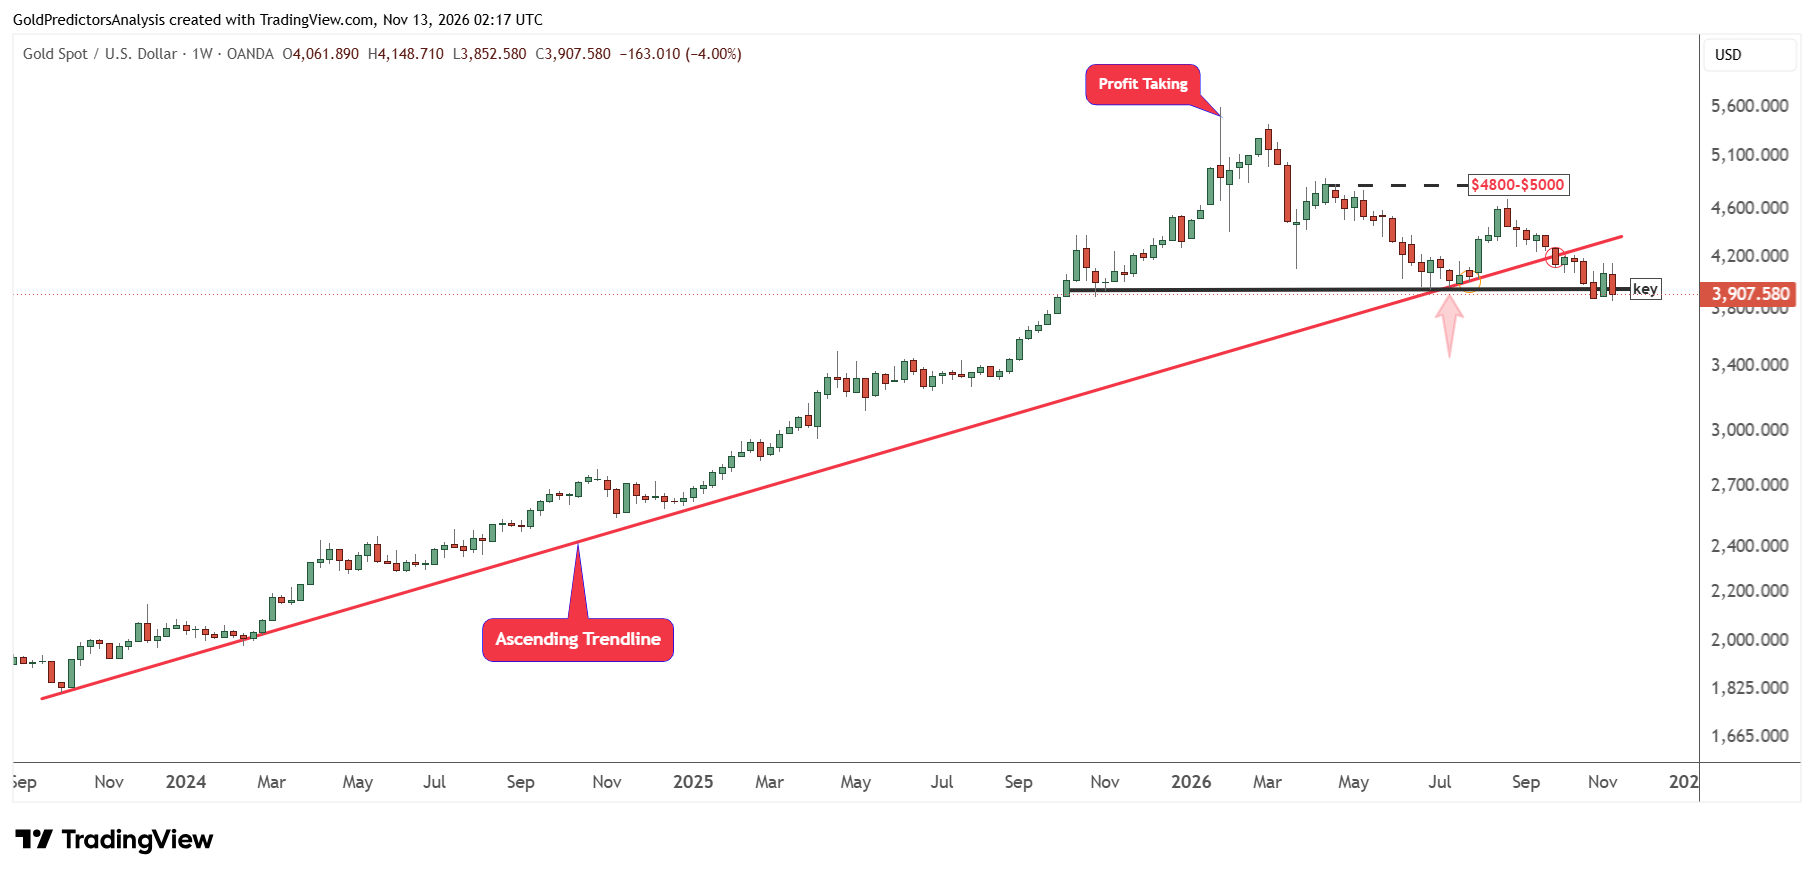
The weekly chart for spot gold also shows that the price continues to drop after the breakdown from the ascending trend line near $4,180. A weekly close below $3,850 will likely trigger deeper correction in spot gold towards $3,500-$3,600. If the price breaks above $4,150, it may trigger a move to the resistance of $4,400.
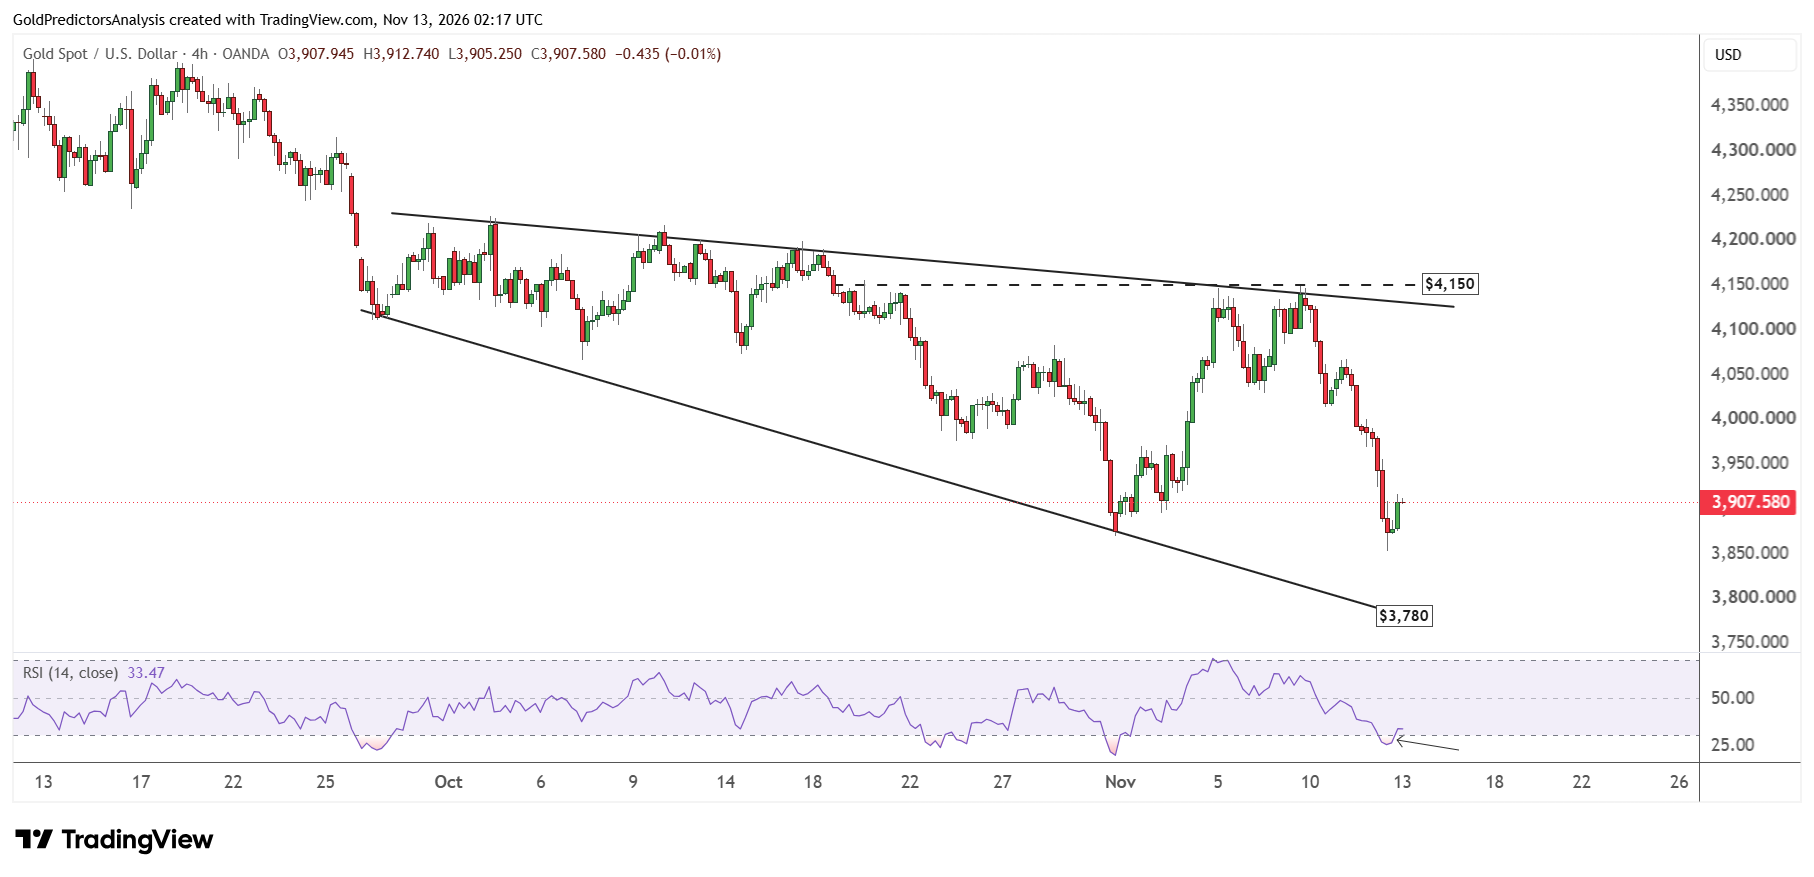
The price action for spot gold shows strong volatility in the short term. This volatility is seen on the 4-hour chart. The chart below shows the formation of descending broadening wedge pattern in October. The support for this pattern remains at $3,780 while resistance lies near $4,150.
The RSI on the 4-hour chart has reached extremely oversold levels which suggests that the rebound may develop from current support levels. The 4-hour chart also shows that a break above $4,150 may trigger strong rally. As long as the price remains below $4,150, the possibility of deeper correction in gold remains high.
Gold Price Forecast
Every new Gold analysis as it publishes, today's technical signal and key levels, live price — on one page.
See all Gold forecastsSilver Price Forecast: A Break Below $50 Could Send Prices to $45
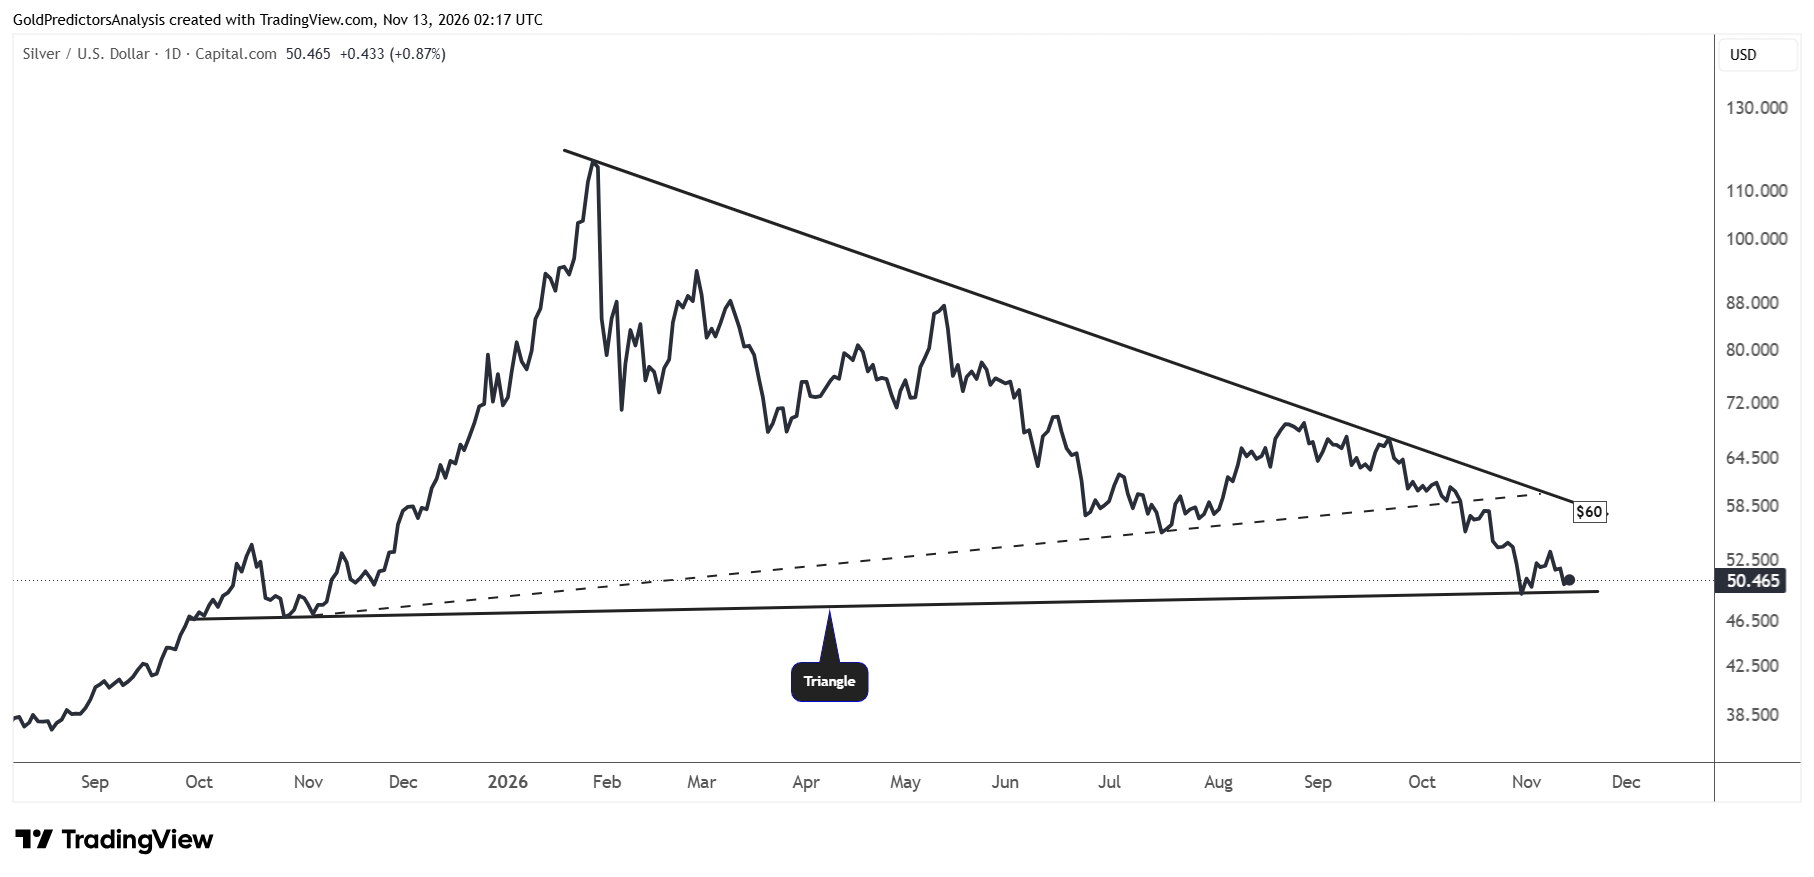
The daily chart for spot silver shows the formation of triangle pattern from the highs of January 2026. The price has been consolidating at the edge of this triangle between $50 and $60.
A confirmed break below $50 will likely open the way for further downside towards the $45 region. But a break above the $60 level will break the triangle to the upside and trigger strong rally toward the $72 level.
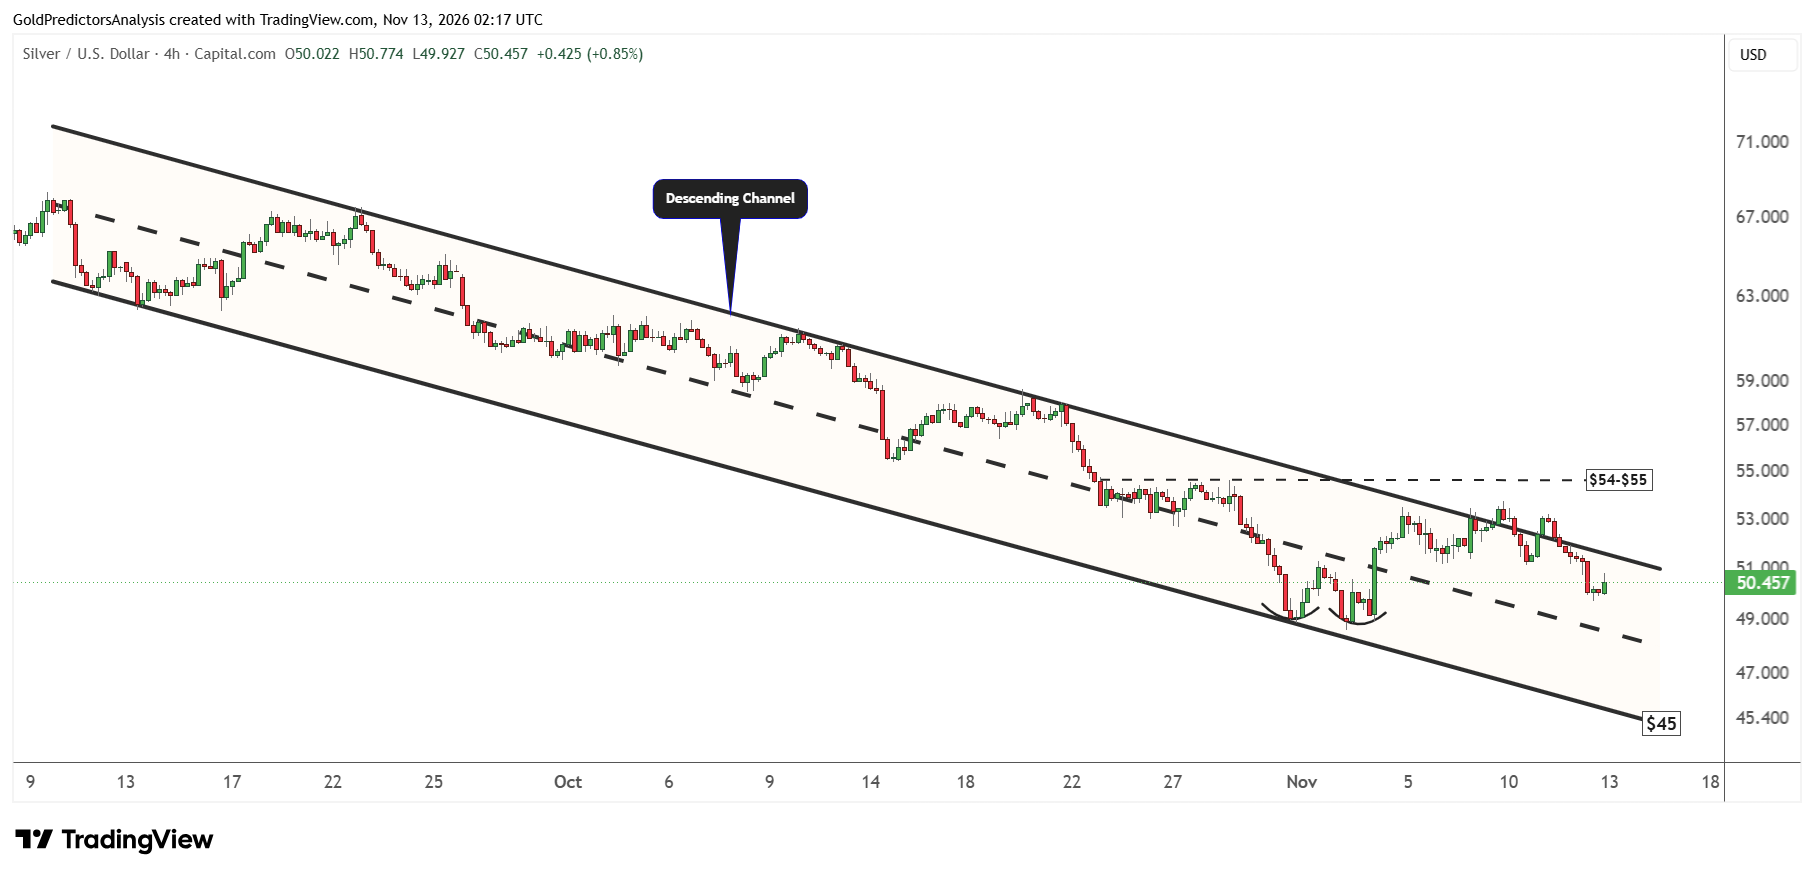
The 4-hour chart for spot silver shows that the price remains within the descending channel pattern that formed in September and October. The price formed double bottom pattern at support near $49 and triggered a rebound towards the resistance of this channel.
But the price failed to break above this resistance and continued to drop. If the price drops below the $48 area, the move will likely open the way for further downside towards the $45 region. But a recovery above $55 will confirm a bottom in the short term and trigger a rally towards the $60 to $70 region.
What to Watch Next
The market is now waiting for the US PPI data on Friday to determine next move in gold and silver prices. If inflation is hot, the gold price may drop further to $3,780 while the silver price may break below the support level of $50.
A confirmed break below the $48-$50 zone in spot silver may open the way for further downside to $45. But the soft inflation data supports a rebound in both metals. Gold price needs to break the $4,150 level and silver needs to break above $55 to signal a stronger recovery.