


At the moment of writing these words, December gold futures trade near $3,935, after touching $3,904.10 earlier today. Most of Monday’s $70.70 rebound is gone, and silver fell below Friday’s low this morning.
In my gold price forecast for November 2026, published on Friday, I wrote: “With the first target reached, the next one is about $3,500.” To see how gold might get there, I compared the current decline with the 2011-2013 period, and one number stands out: 17.5 percent. That’s how much gold fell from its final top to its breakdown, both in 2013 and this year.
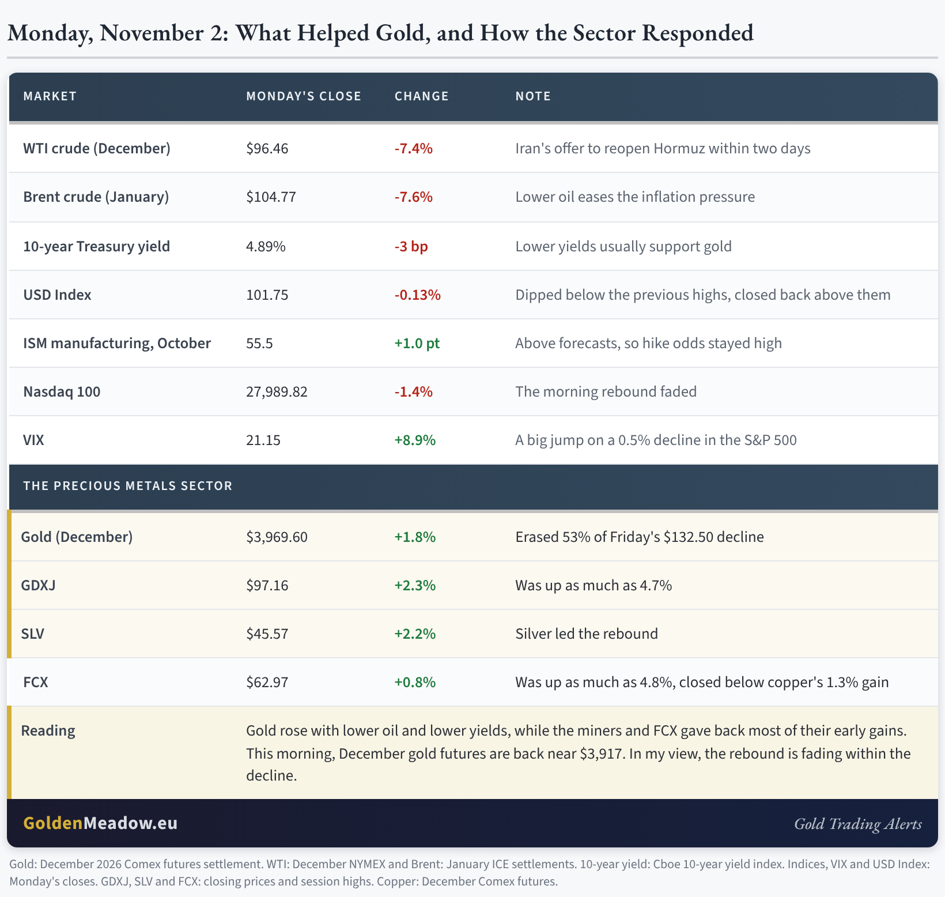
December gold futures rose $70.70 on Monday and settled at $3,969.60, as crude oil fell 7.4 percent and the 10-year Treasury yield fell to 4.89 percent. Lower yields reduce the cost of holding gold, which pays no interest, so this was a day that should have helped gold. Today, gold is giving back most of that gain, even though the USD Index is little changed. The table below shows what helped gold on Monday and how the sector responded.
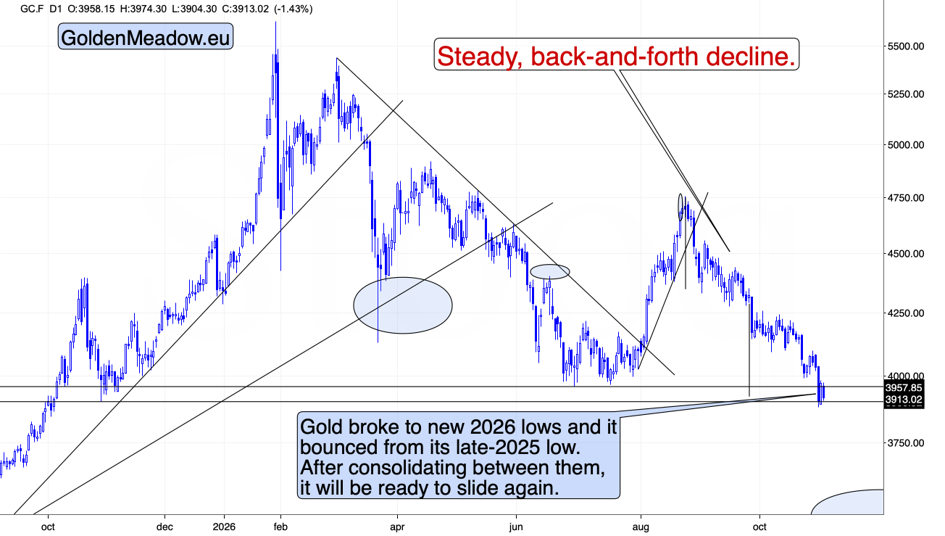
In my view, gold’s muted reaction to supportive news and its strong reaction to unsupportive news remain bearish information. On October 29, I wrote: “The head-and-shoulders top on the above chart was completed, and its downside target is about $3,920.” Gold reached this target the next day and closed the week below it. Friday’s close below gold’s 2026 lows and the quick fade of Monday’s rebound remind me of gold’s behavior in 2013, after the breakdown below its 2011-2012 lows.
Gold Price Forecast
Every new Gold analysis as it publishes, today's technical signal and key levels, live price — on one page.
See all Gold forecasts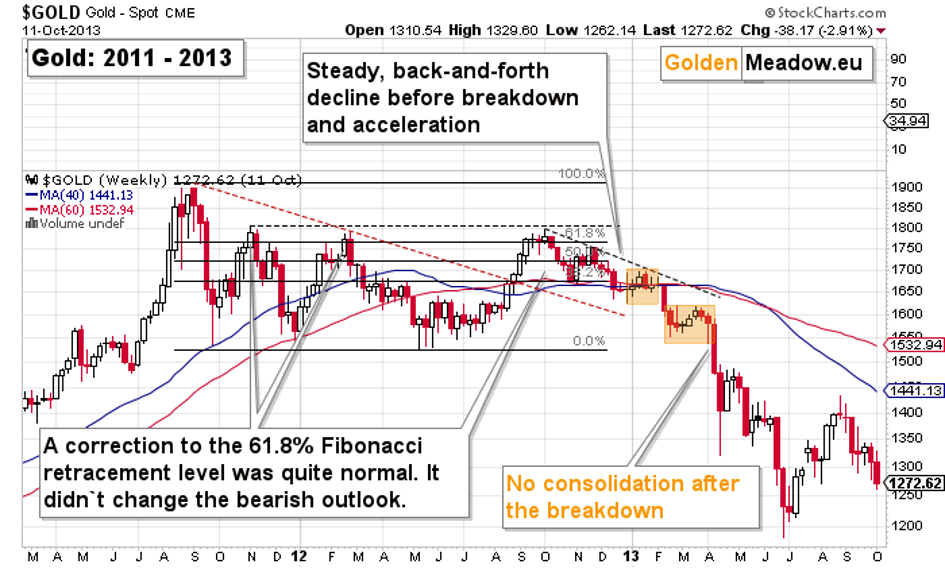
Spot gold topped at $1,920 on September 6, 2011. Its final top came on October 5, 2012, at $1,796, 6.5 percent lower and 395 days later. As the above chart shows, a correction to the 61.8 percent Fibonacci retracement level was quite normal, and it didn’t change the bearish outlook. Then came a steady, back-and-forth decline. On April 12, 2013, gold closed below its 2011-2012 lows, a major support level, 17.5 percent below the final top.
There was no consolidation after the breakdown. Gold crashed 10.8 percent in four days, to its April 16 low, then corrected 12.6 percent until May 3, and then fell 20.6 percent more, to its June 28 low.
The Same 17.5 Percent in 2026
This year’s decline has a similar structure, and the table below puts both periods side by side.
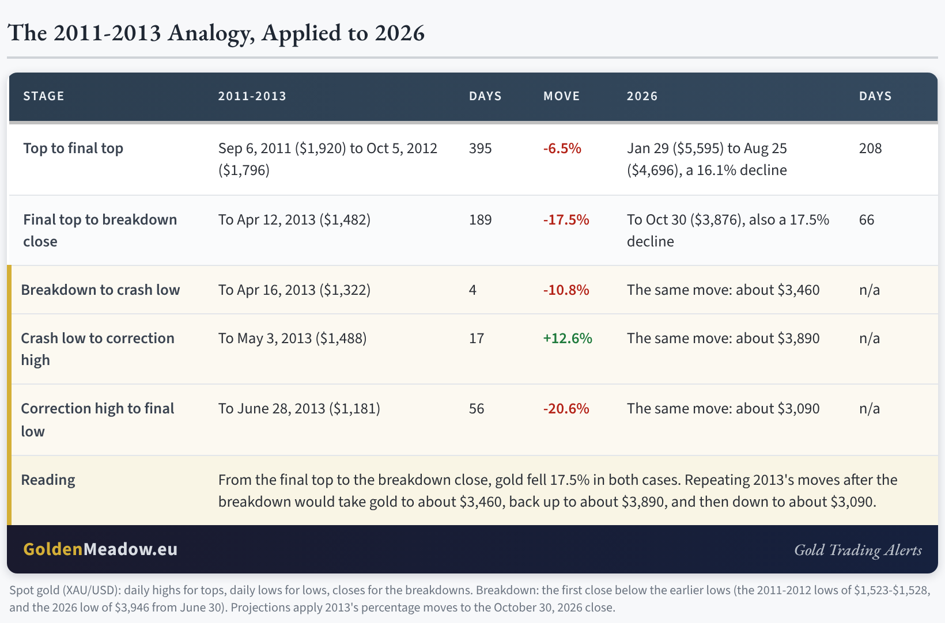
Spot gold topped at $5,595 on January 29, 2026, and its final top came on August 25, at $4,696. From there to the October 30 breakdown, when gold closed below its 2026 lows, it fell 17.5 percent, the same as in 2013. It took 66 days instead of 189, and the consolidation between the two tops took 208 days, compared with 395 days in 2011-2012. In 2026, the same steps are happening faster.
What the Analogy Implies
If gold repeats 2013’s moves after the breakdown, it would fall to about $3,460, then correct to about $3,890, and then slide to about $3,090. This lines up with what I wrote in the same forecast: “Once gold tests about $3,500, I expect a rebound to more or less the current levels, with gold verifying $4,000 as resistance.” After that rebound, I expect gold to fall to the low $3,000s or even lower.
The analogy also says something about timing. I applied 2013’s durations to 2026 in two different ways, and both point to a bottom of this part of the decline within days of each other.
Where This Leaves Us
Gold’s rebound lasted one day, silver fell below Friday’s low, and the decline from this year’s final top matched 2013’s 17.5 percent before the breakdown. In my view, the next big move in gold is down, toward about $3,500.
In 2013, the breakdown was followed by no pause at all. This time, the pause lasted one day.
Important note: the forecasts are up-to-date at the moment of their publication, we don’t guarantee updating them for free readers. We will, however, keep our premium subscribers updated at all times.
Thank you for reading today’s analysis – I appreciate that you took the time to dig deeper and that you read the entire piece. If you’d like to get more (and extra details not available to 99% investors), I invite you to stay updated with our free analyses – sign up for our free gold newsletter now.
Thank you.
Sincerely,
Przemysław K. Radomski, CFA