


Breakout Retest Puts Recovery to the Test
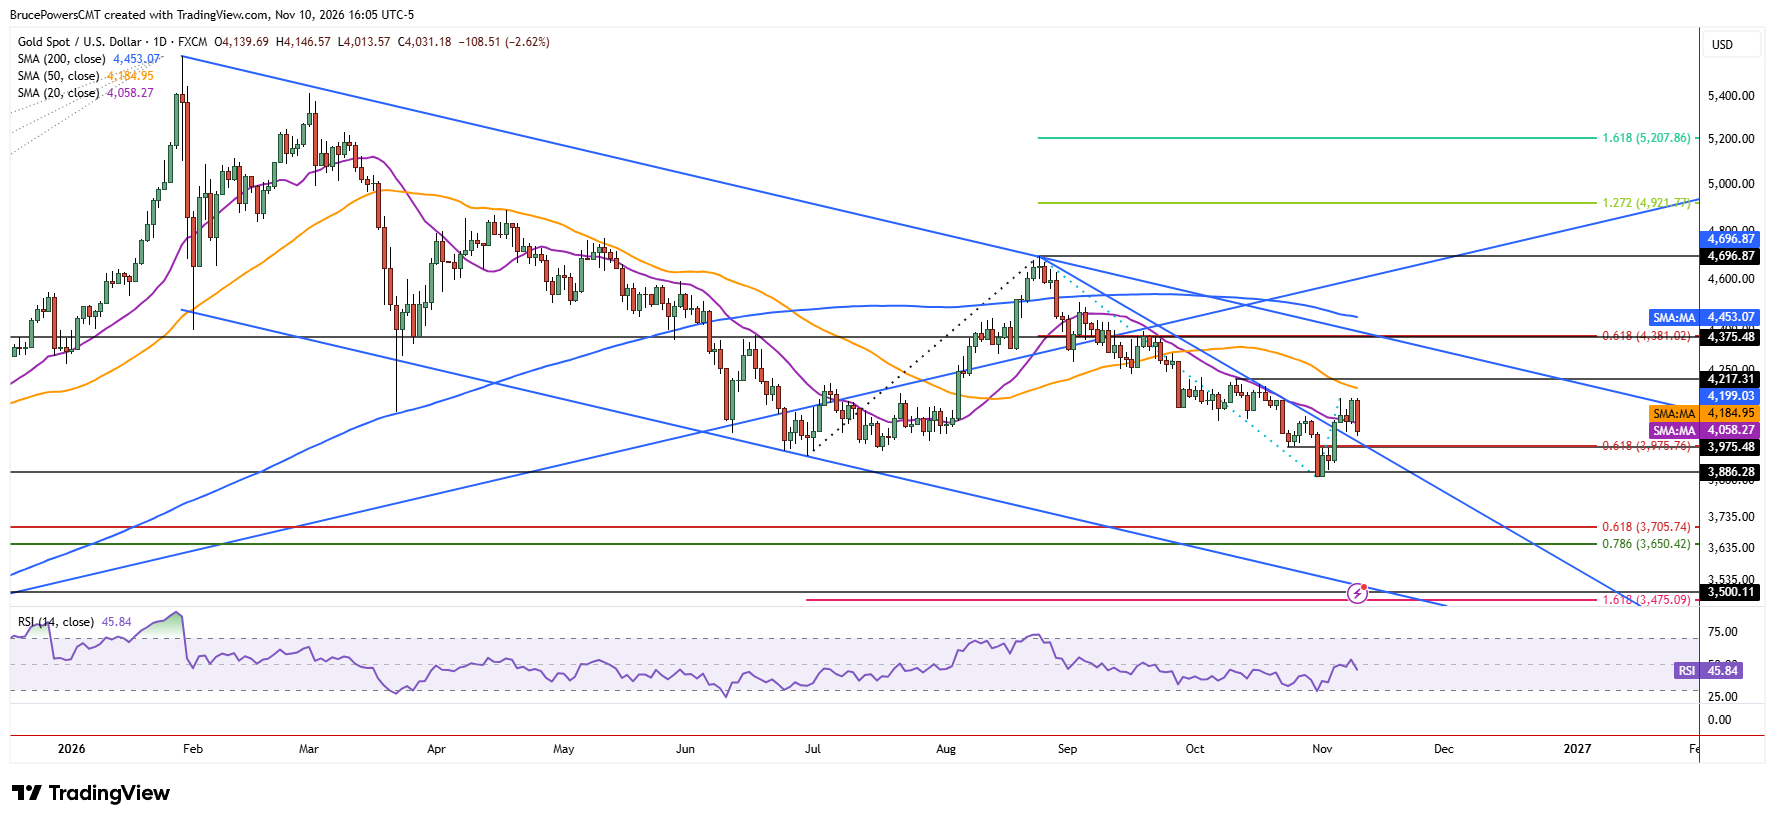
Gold pulled back to a four-day low of $4,014 on Tuesday, as it approaches a test of the former declining trendline resistance, now potentially acting as support. The 20-day moving average was a second trend indicator that was reclaimed the day after a rally above the trendline.
The recovery above both trend indicators was confirmed by a daily close above each line. Subsequent price action has generated a consolidation range from $4,014 to a $4,149 high reached on Monday. The ability to hold within this range will help determine whether the recent breakout can develop into a sustained recovery.
Fibonacci Confluence Defines Critical Support
The consolidation and pullback are potentially bullish developments if key support continues to hold. Although the trendline marks a key support zone, it can be more useful as an information signal when reinforced by other indicators. While the 50% retracement of the prior advance is at $4,005, the confluence of a higher swing low at $3,975 from late October and the 61.8% Fibonacci retracement at $3,976 could act as a magnet, potentially drawing price toward that zone before the current pullback completes. Nevertheless, the larger developing pattern continues to suggest an eventual recovery to the upside. The longer and more complex the back-testing and bottoming process, the greater the potential reliability of a new advance.
Failed Breakdown Shifts Control to Buyers
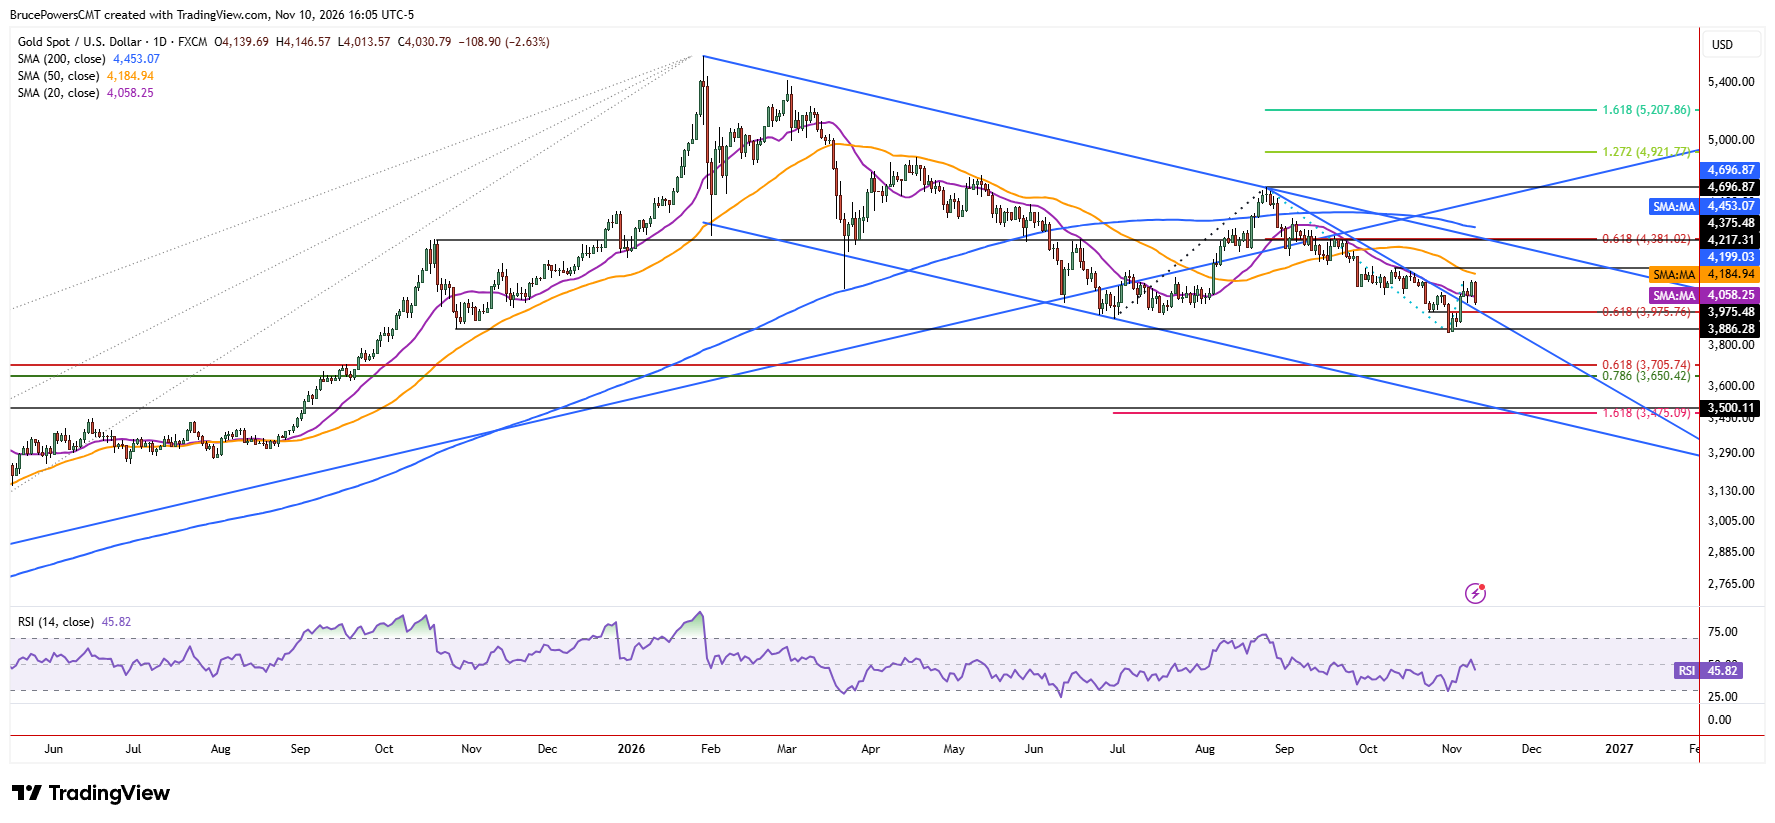
Gold reached a new low for its bearish correction two weeks ago at $3,870, after triggering a trend continuation signal below the lower swing low of $3,942 from late June. However, that level was quickly recovered last week, with a close above it at $4,065. This suggests a failure of the bearish extension. Failed breakouts have the potential to swing sharply in the opposite direction. At a minimum, it signals a shift in control from sellers to buyers. That shift has only just started, suggesting an eventual upside continuation, or sideways consolidation that retains support at $3,870.
Upside Confirmation and Next Resistance Targets
The first pullback after a significant breakout signal has a reputation for providing good risk opportunities since support is well defined. A decisive rally above last week’s high of $4,147 would put gold on track to test the lower swing high at $4,217, followed by another lower swing high at $4,399. The 61.8% Fibonacci retracement at $4,381 reinforces that higher resistance zone. A successful move through these resistance levels would further confirm the developing bullish reversal suggested by the failed bearish extension and subsequent recovery.
If you’d like to know more about how to trade gold and silver, please visit our educational area.