



Gold (XAU) prices remain strong on Thursday after the strong rally on Wednesday. Oil prices dropped by over 15% from the highs of 30 October and continue to drop on hopes for a peace deal between the US and Iran after the US midterm elections. The hopes for a peace deal may keep oil prices under pressure and raise expectations of lower inflation. The market is now waiting for the US jobs data on Friday to understand the next move in gold.
Gold Rallies on Dollar Weakness and US–Iran Peace Hopes
Gold price continues to rally on Thursday and gained over 2% after the strong surge on Wednesday. The strong drop in the US dollar index and US Treasury yields continues to support the rally in gold.
This surge in the gold market comes after the US midterm elections, which raised hopes for peace deal between the US and Iran. A peace deal between the US and Iran may reduce inflation pressure by easing the supply disruptions in the Middle East. This may ease expectations for higher interest rates. Oil prices have already lost over 8% on Wednesday and continue to see pressure in the short term.
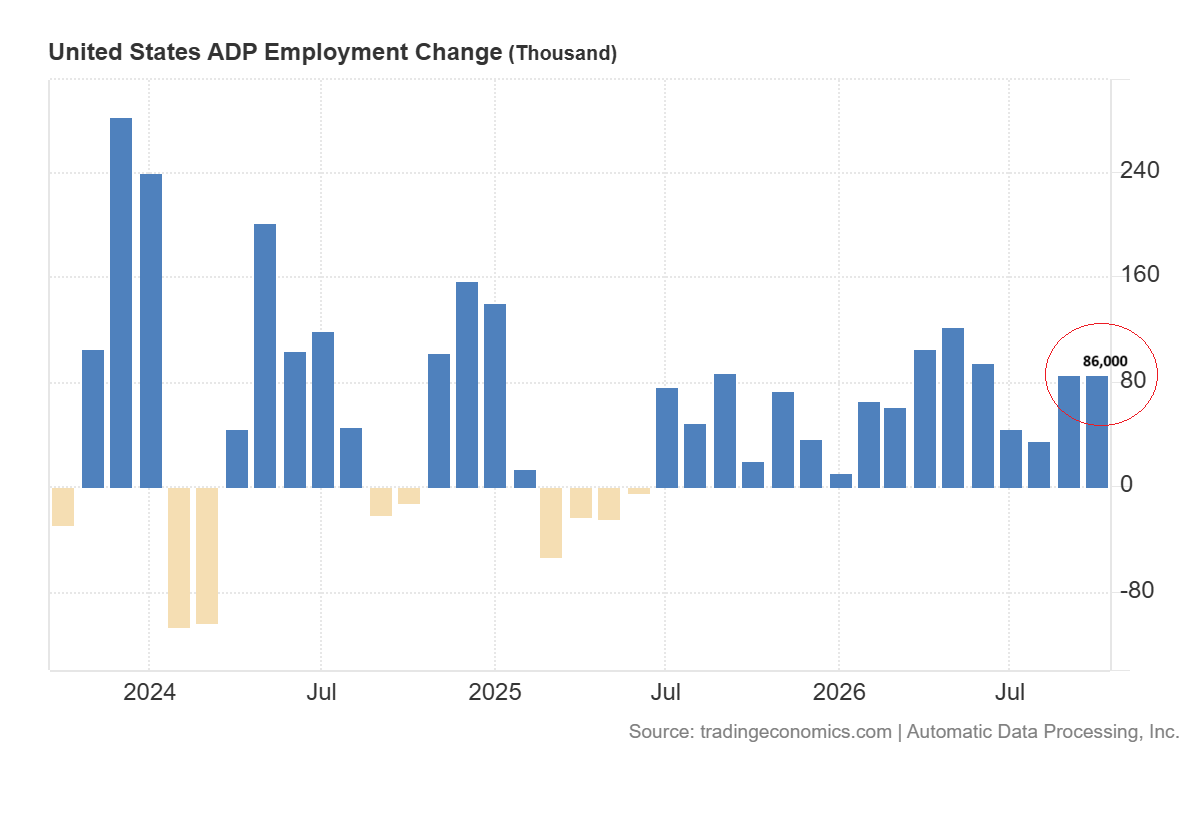
But US data shows that ADP reported 86,000 new private sector jobs in October which was above the forecast of 69,000.
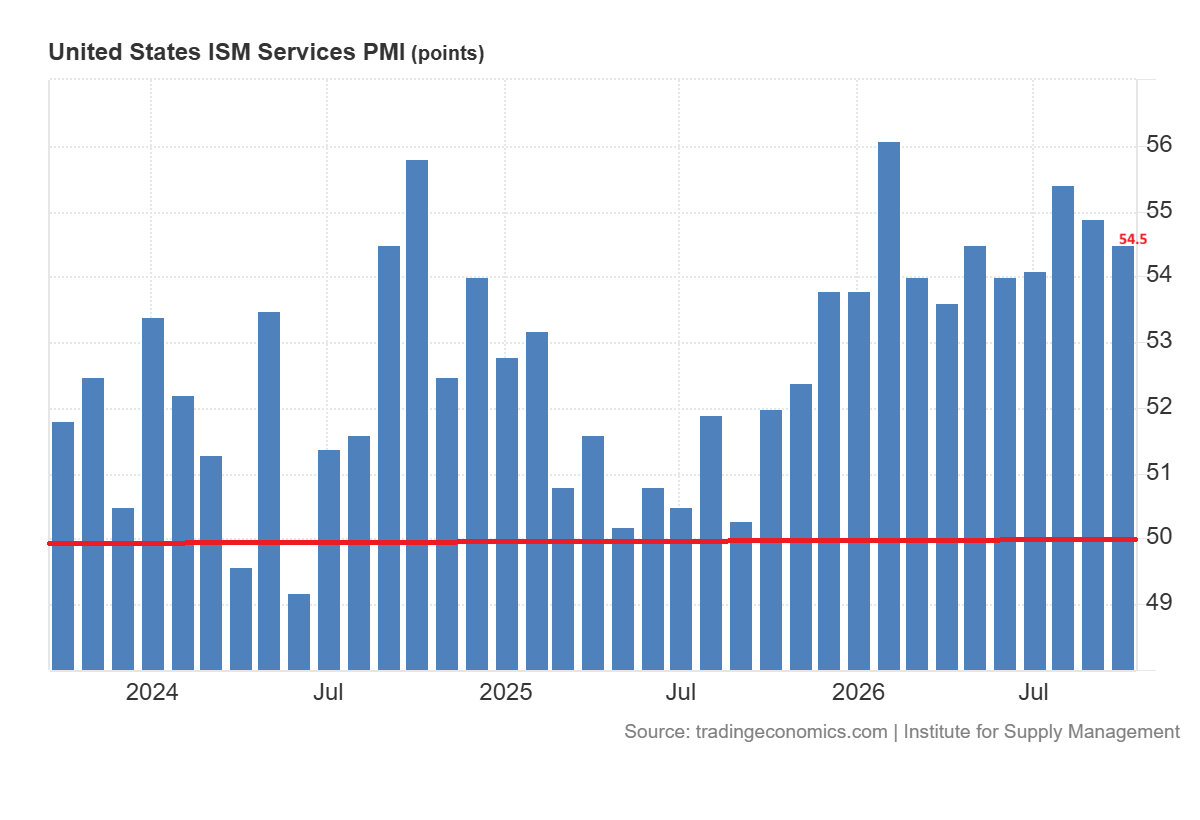
The chart below shows that the ISM services PMI dropped to 54.5 from 54.9. But the price index remains high at 73. This suggests that there is pressure on prices despite slower business growth, which could keep expectations of rate hike in December.
As per the FedWatch tool, the market expects 81.8% chance that the Fed will raise interest rates in December.
The market is now waiting for the US jobs data on Friday which may provide more clues about the next direction. The weak jobs data may continue the rally in gold to push above the key resistance areas. But strong data may limit the recovery near resistance levels. If the hopes for a peace deal between US and Iran remain alive, gold prices may continue to see strength.
Gold Price Forecast
Every new Gold analysis as it publishes, today's technical signal and key levels, live price — on one page.
See all Gold forecastsCentral Bank Buying and Investment Demand Support Gold
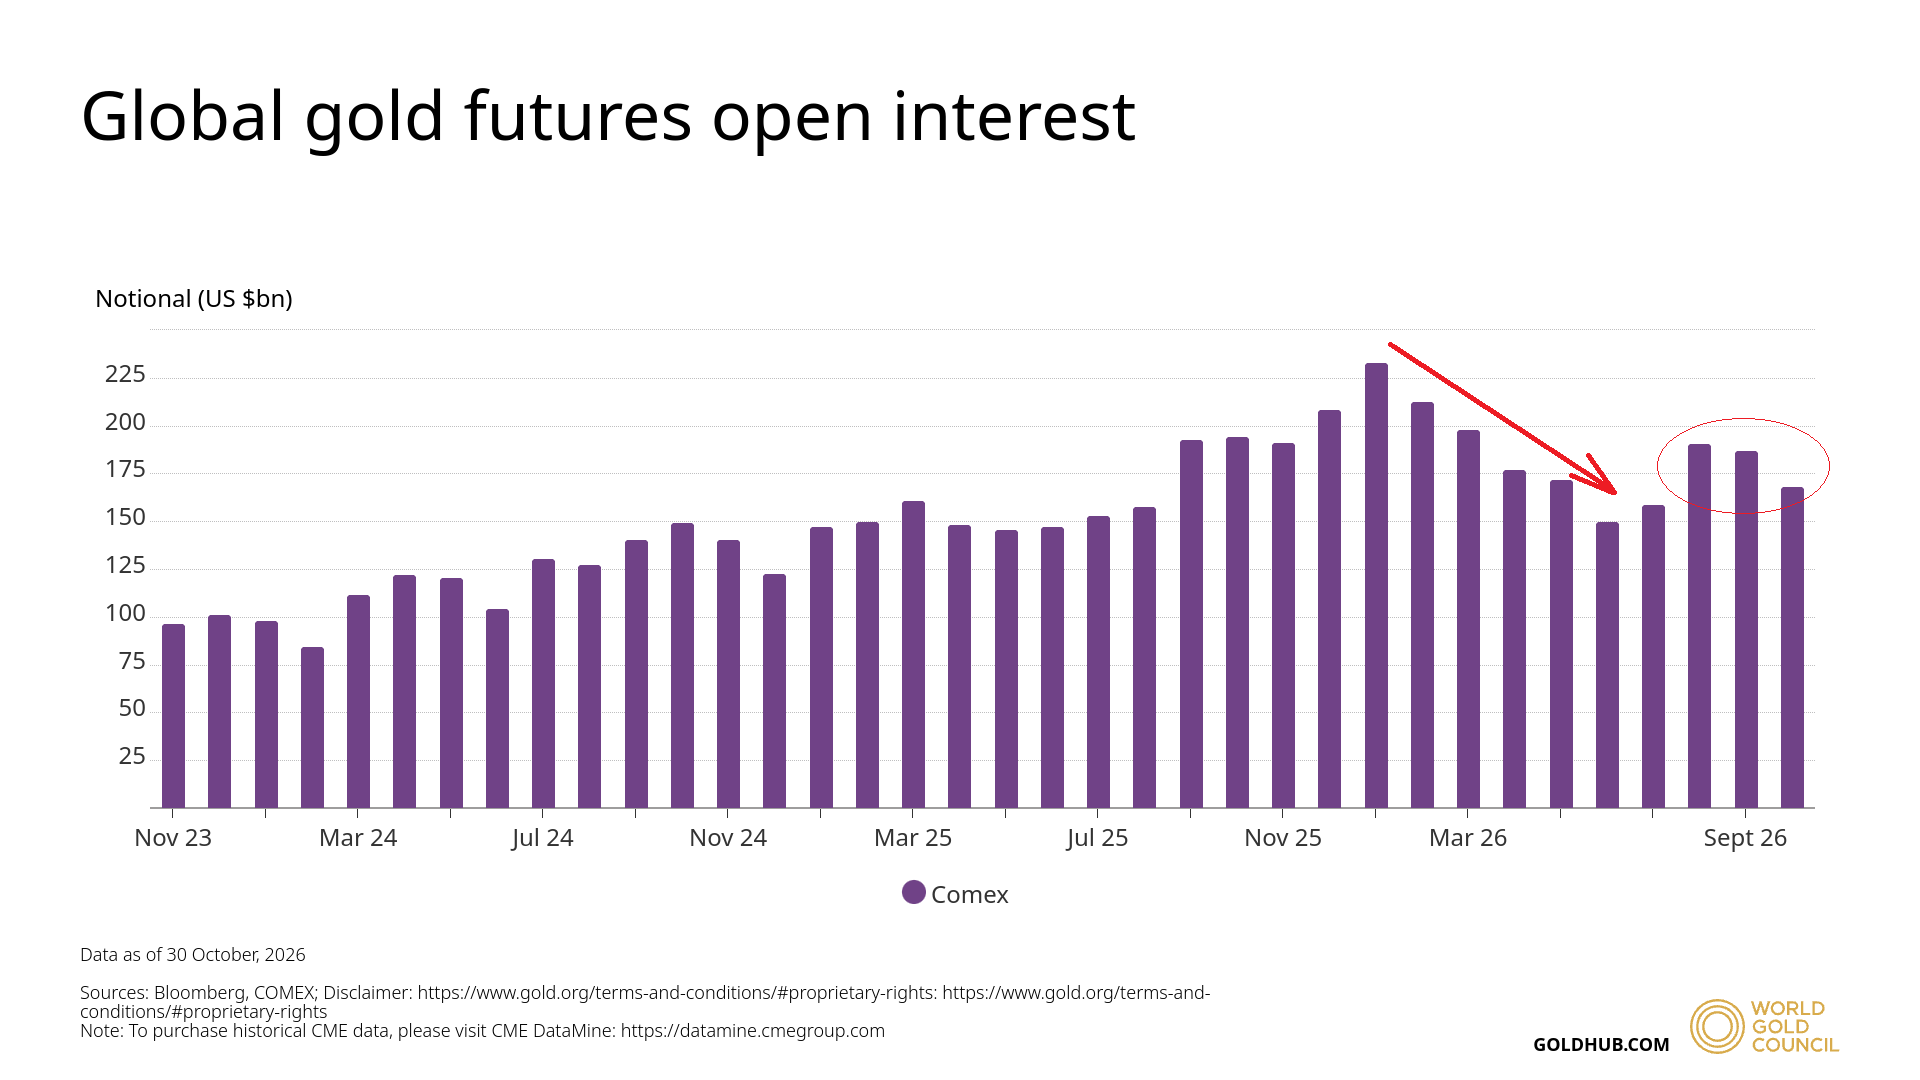
The chart below shows that COMEX gold open interest declined significantly in the first half of 2026. Open interest declined from $233.2 billion in January 2026 to $149.9 billion in June 2026. But open interest is recovering in the second half and the October figure shows open interest of $168.5 billion.
Central banks have also purchased significant amounts of gold in Q3 as seen in the chart below. It is observed that net gold purchases of central banks cooled to 57.7 tons in Q1 2026. But central banks bought 296.3 tons in Q2 and continued to buy gold in Q3 2026 with purchases of 321.2 tons.
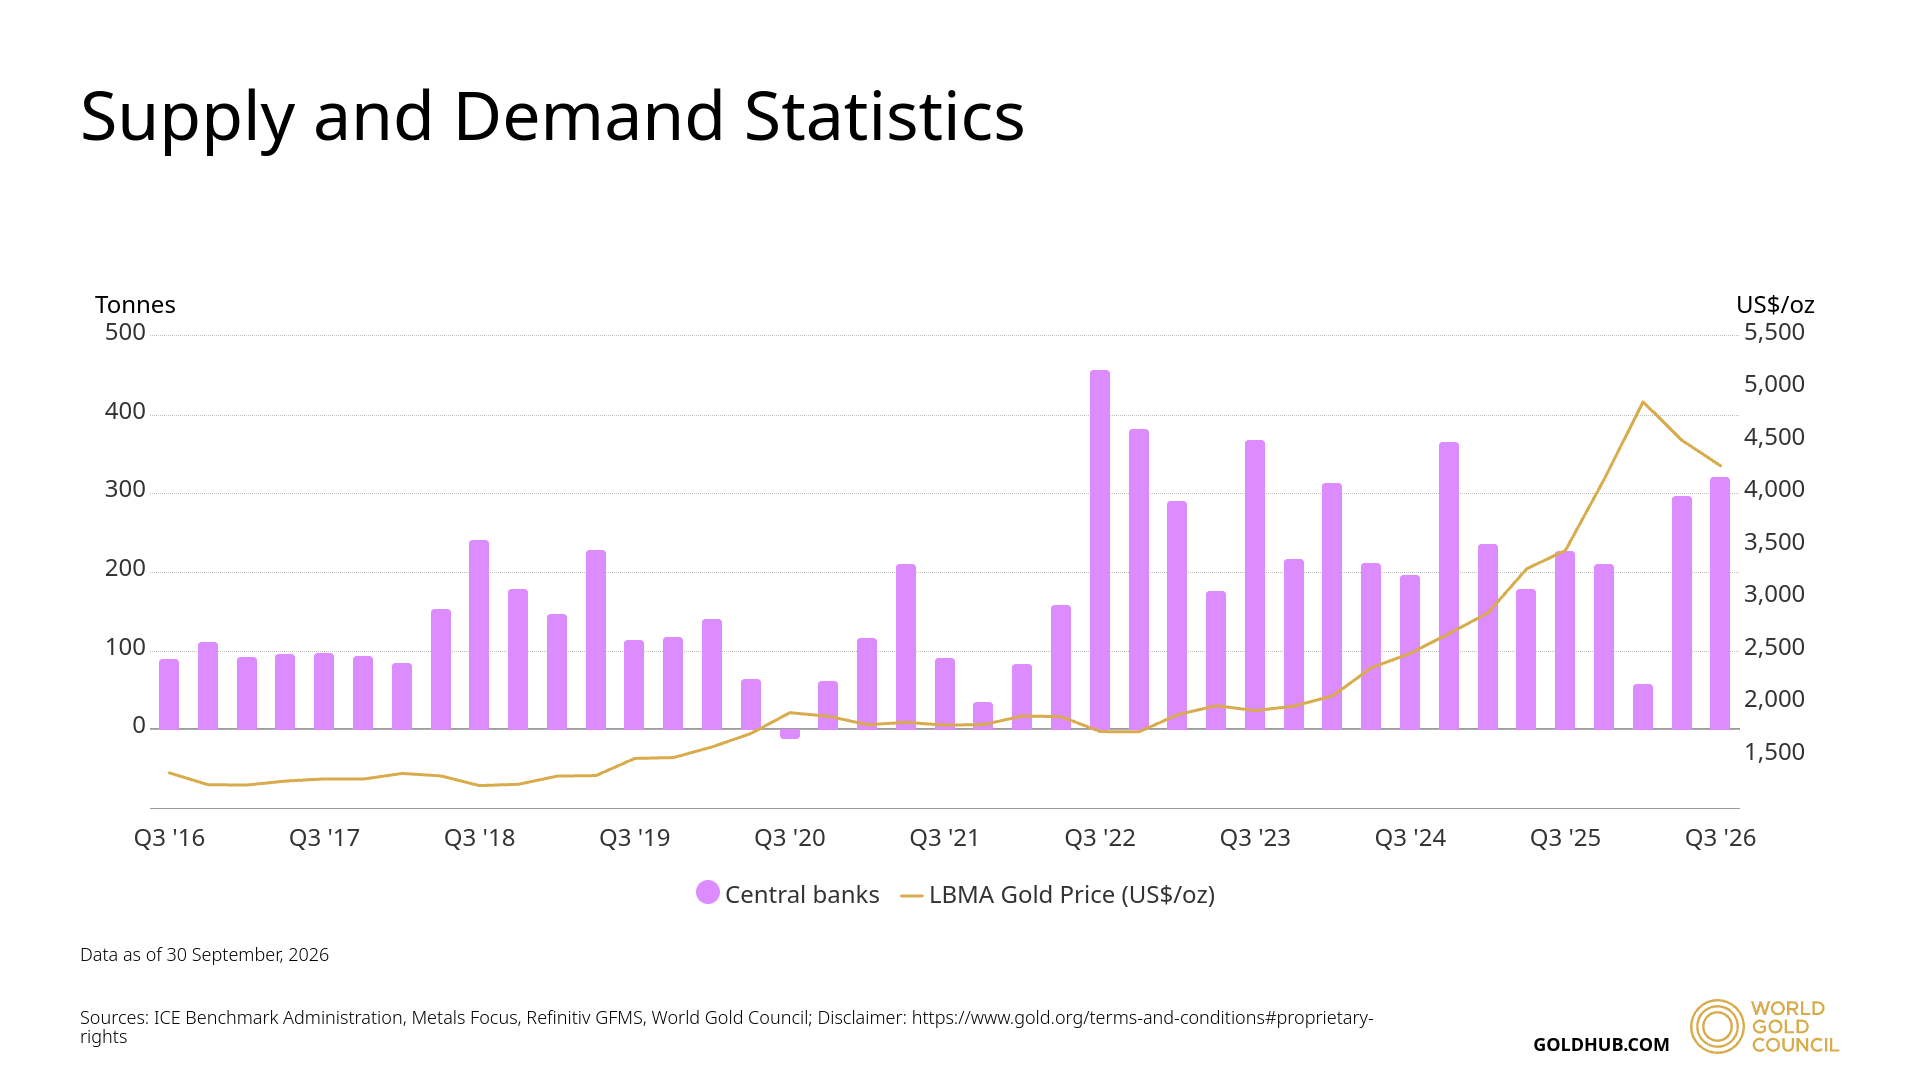
The chart shows that buying interest by central banks and lower gold prices in Q3 may attract more buyers in the market.
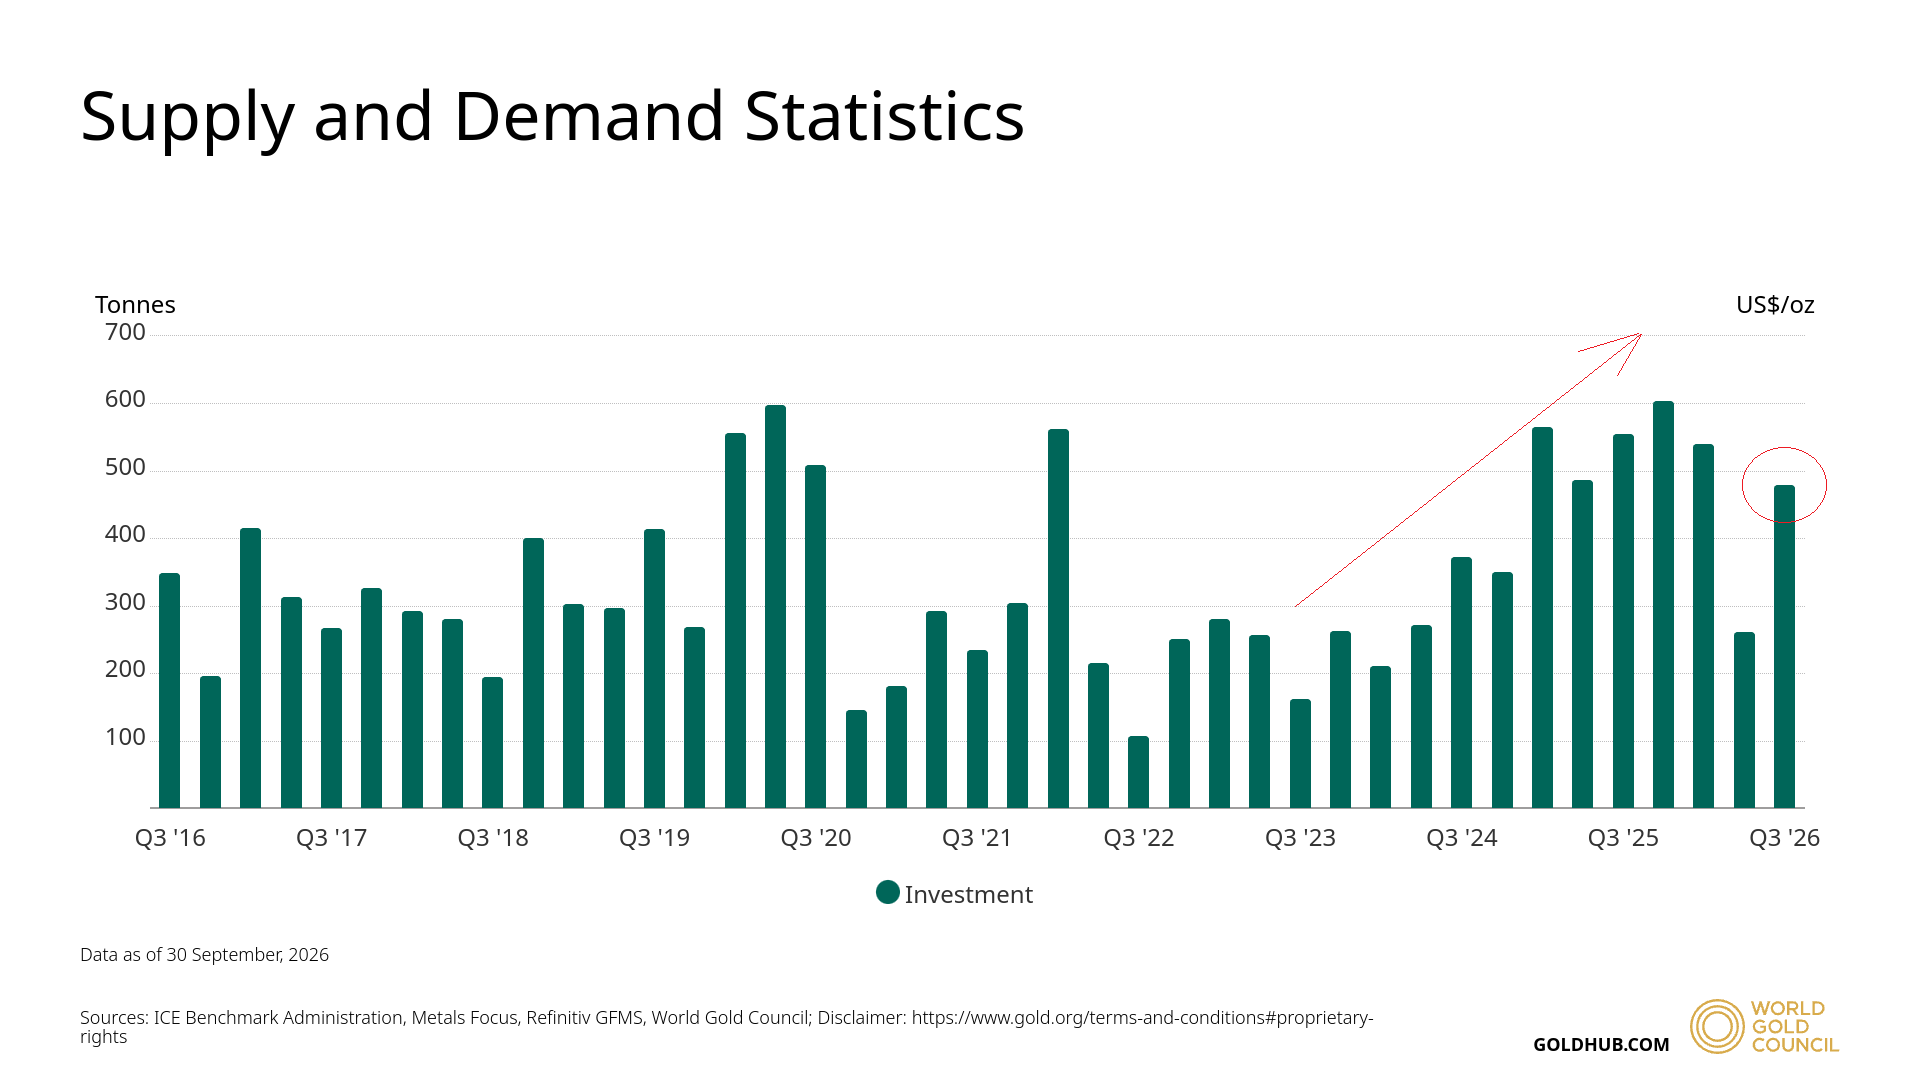
The same interest is also seen in investment. Investors bought 479 tons in Q3 2026 after a drop to 261.2 tons in Q2. The chart also shows an emerging trend in investment since 2024.
Gold Price Forecast: $4,150 Break Could Lift Prices to $4,300
From a technical perspective, gold prices have produced a bear trap and gained over 6% this week to trade near the $4,135 level on Thursday. The price has recovered from the long term support region of $3,900 to $4,000. This suggests that any weekly close above the 10-week moving average at $4,150 will likely open way for further upside towards the $4,500 to $4,600 region.
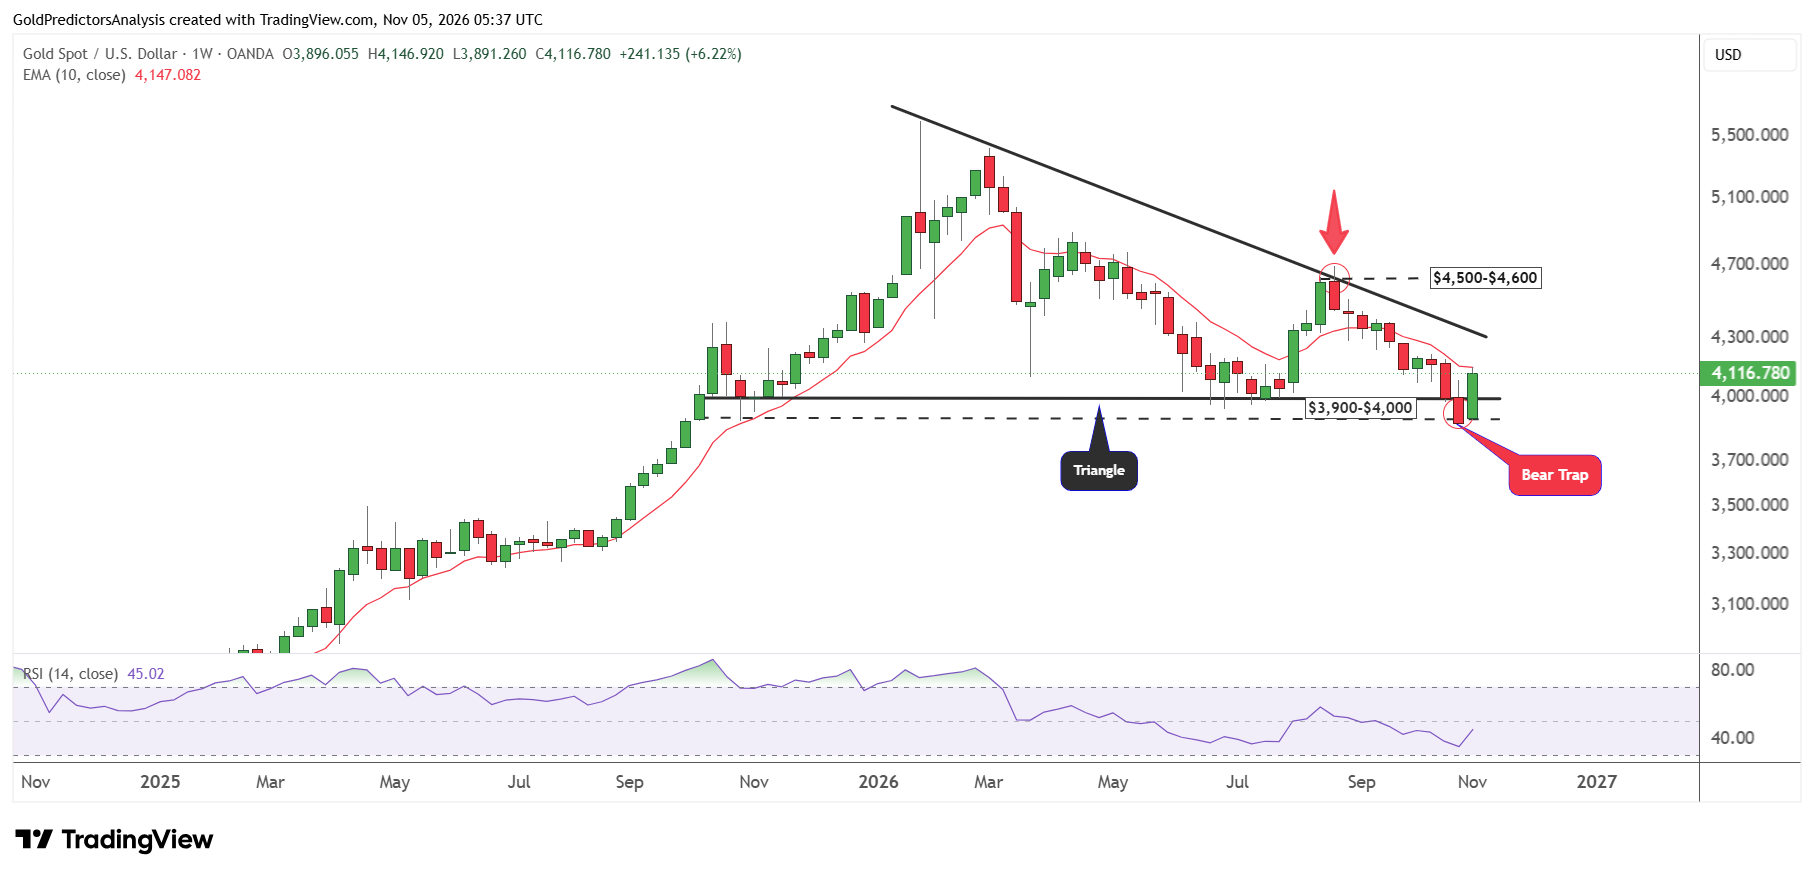
But the immediate resistance after $4,150 will likely be $4,300. This resistance is defined by the descending trend line of the triangle that emerges from the highs of January 2026.
It is interesting to note that the RSI on the weekly chart is recovering from the 35 level. This is close to the level of 31, which was seen in September 2022, when gold produced a long-term bottom and surged to $5,600.
If similar conditions develop and the gold market breaks above $4,600, it will increase the chance of a long-term bottom and trigger rally towards higher targets.
What to Watch Next
The market is now watching for the US jobs data which will be released on Friday. A weak jobs report may support the rally in gold prices. But strong data may support the rally in the US dollar, which may limit the current rally in gold. The market is also watching for developments between the US and Iran. Any progress towards the peace deal between the US and Iran may support a strong rally in gold prices.
In my view, gold needs to close the week above $4,150 to strengthen the recovery towards the $4,300 level. A break above $4,300 will likely open the way for a strong rally to $4,500-$4,600. Gold prices must hold the $3,900-$4,000 level to remain bullish in the short term.