



Bitcoin (BTC) price has corrected in October from the highs near 87,200 but the price still remains within a bullish structure. The near-term range in Bitcoin remains between the $80,000 and $87,200 levels. A break of this range will likely define next move in the short term. But the recovery from $60,000 in Bitcoin is constructive and the Bitcoin-to-gold ratio has also formed bullish base above the long-term support areas. This suggests that Bitcoin may remain strong in the medium term as long as the price remains above the $60,000 area.
Bitcoin Price Analysis: $87,200 Breakout Could Open Path to $100,000
The weekly chart for Bitcoin shows that the price has formed a strong bullish structure on long-term basis. The price has formed the ascending channel pattern that stretches from the July 2017 lows.
Then, the formation of cup patterns within this ascending channel from March 2021 to October 2024 suggests a strong bullish outlook. Now, prices are consolidating above the 200-week SMA and suggest further upside if prices hold the support zone of $50,000 to $60,000.
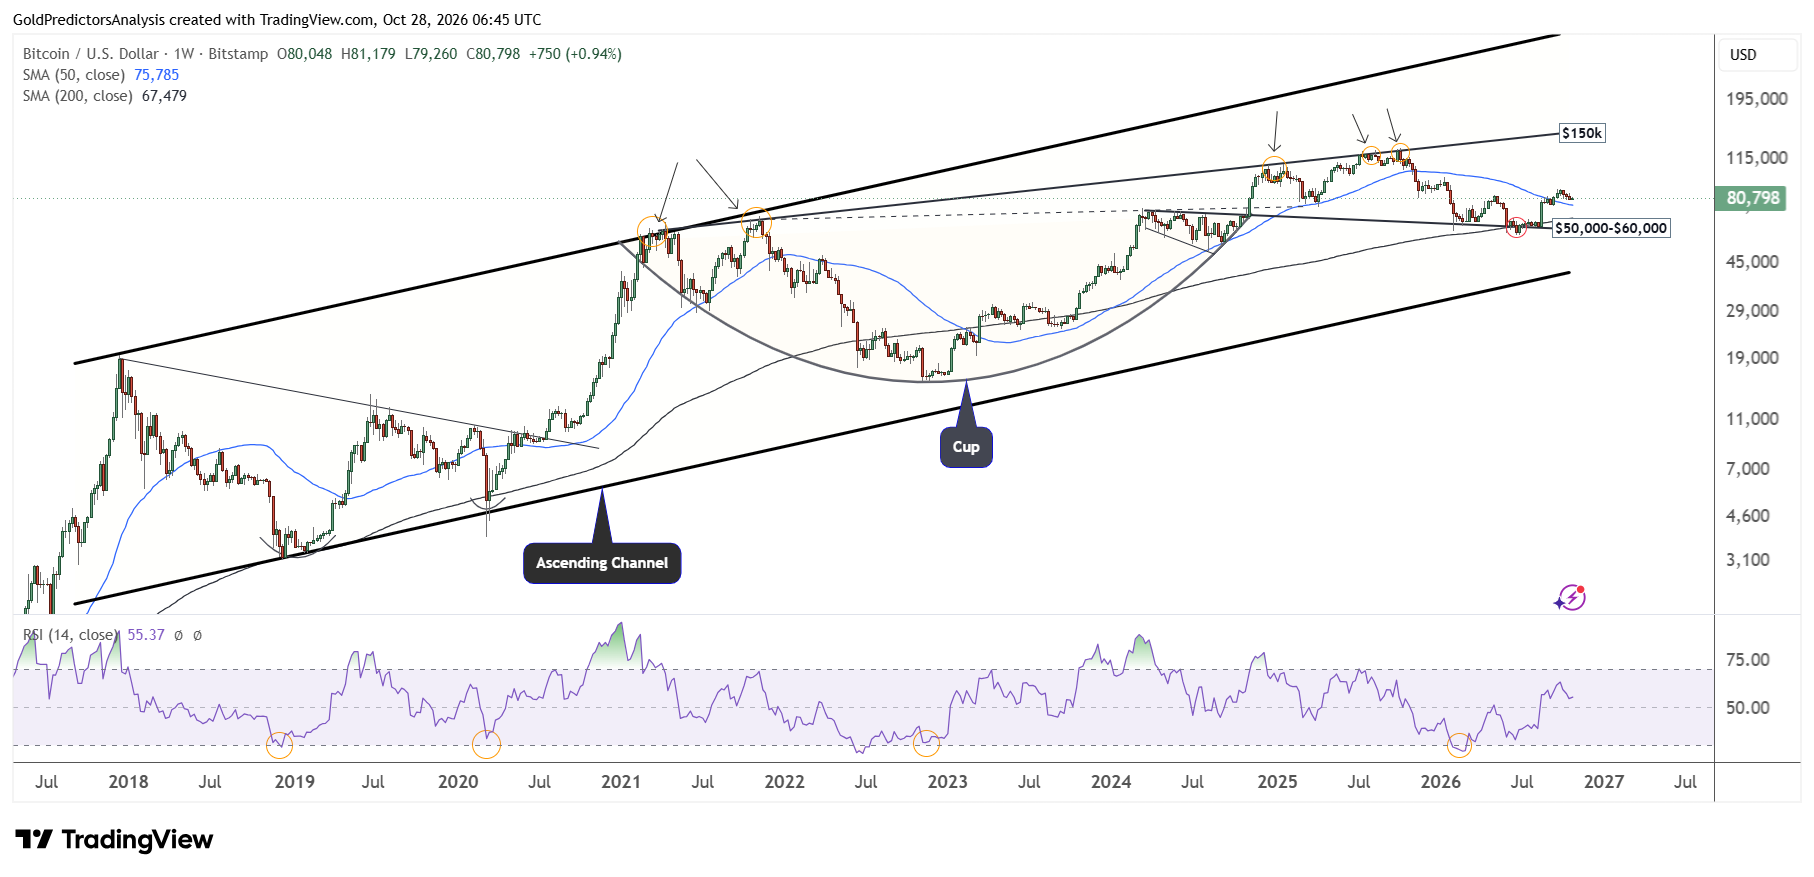
If the price moves above $87,200, it will likely face immediate resistance near $100,000. But a break above $100,000 will likely push the price towards the target of $150,000. This target is defined by ascending trend line that stretches from the 2021 highs. The RSI remains above the midline, which suggests positive trend in Bitcoin.
The positive structure in Bitcoin is also observed in the chart below. It is observed that the price has recovered from the $60,000 support zone with positive structure. The price is now consolidating within the yellow zone. This suggests that a break above $87,200 will likely open the way towards the $100,000 area.
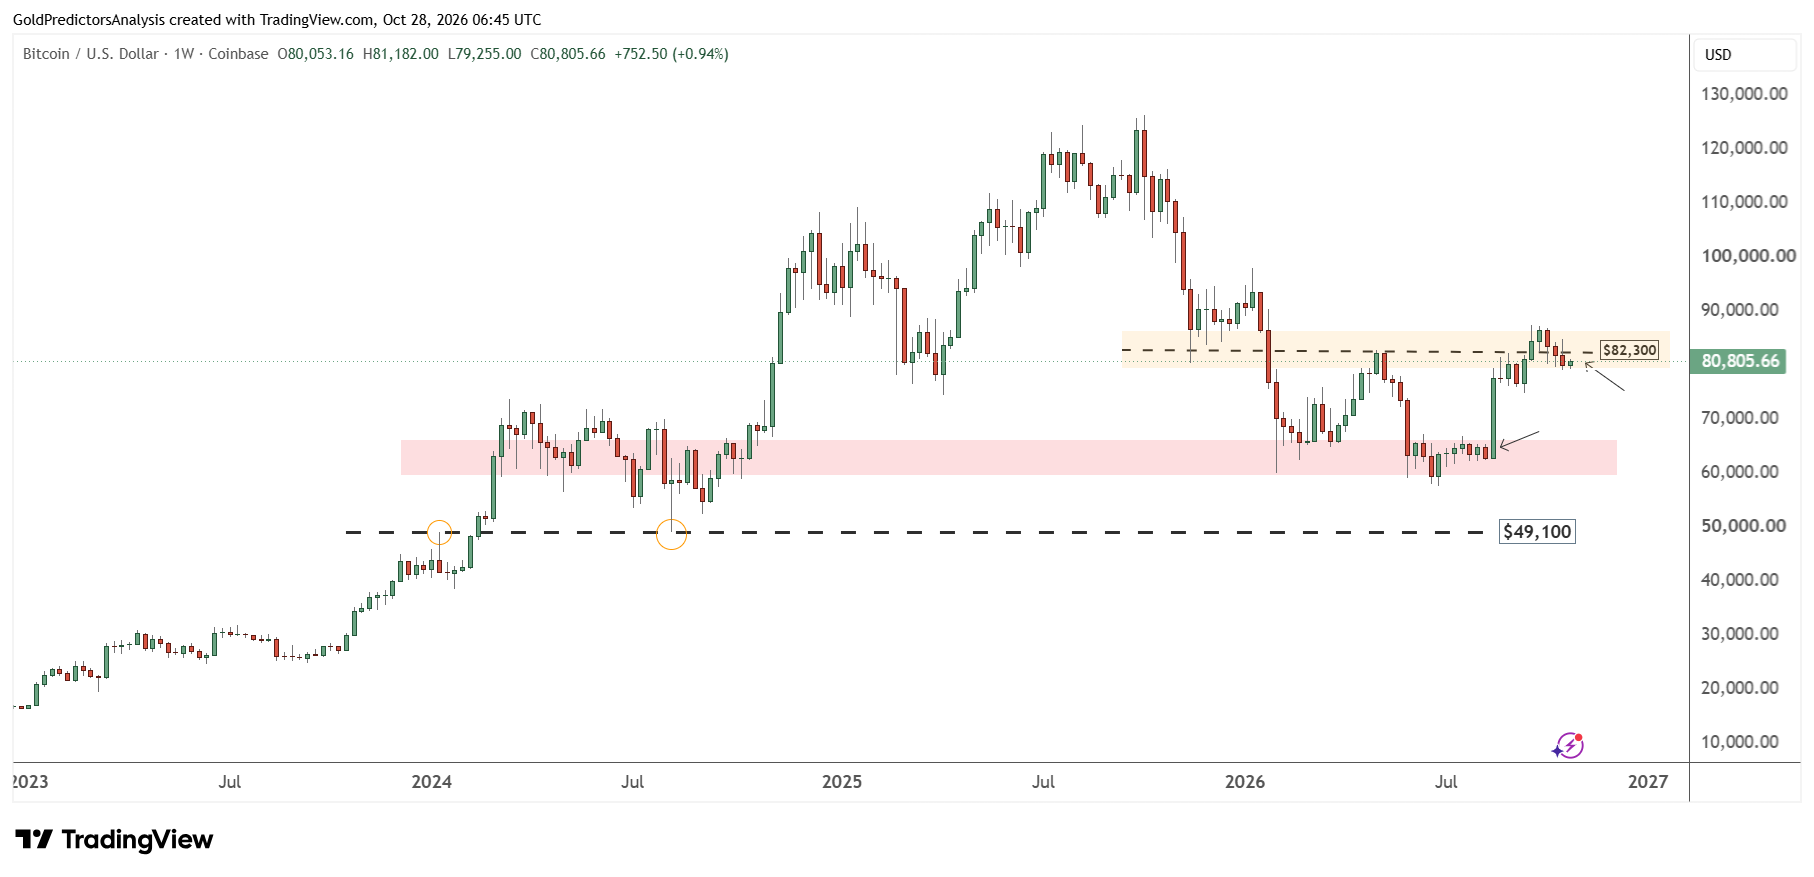
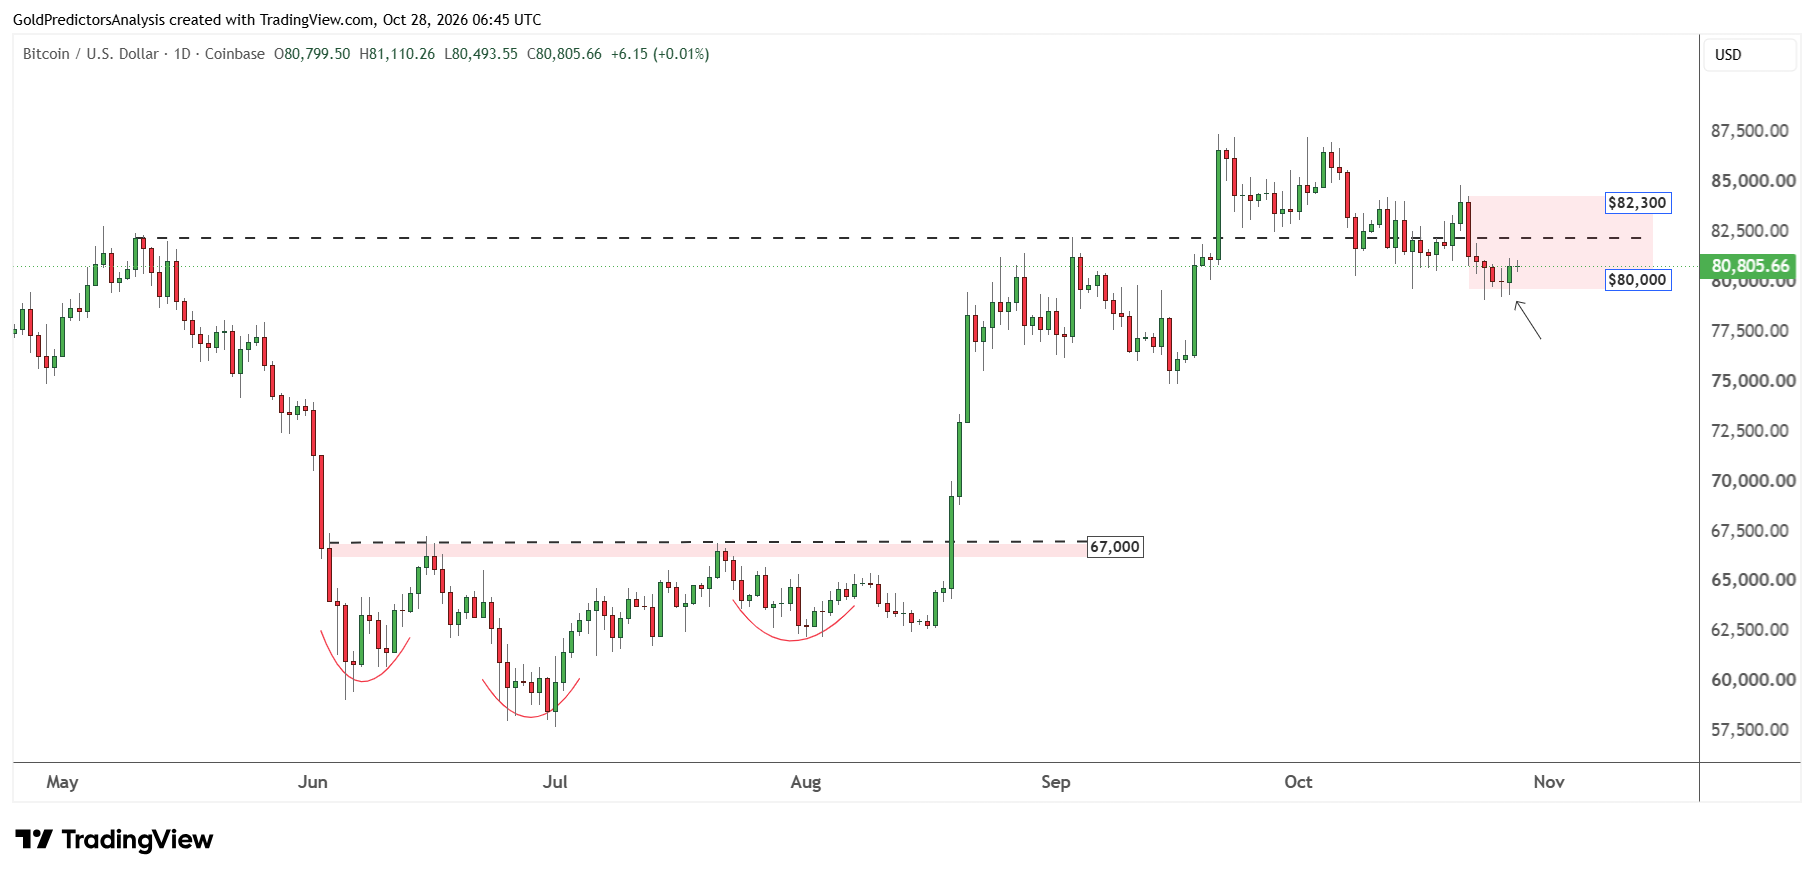
These consolidations in the short term are seen in the red region. The chart shows that the recent range remains between the $80,000 and $82,300 levels. The price has already formed bullish hammer candle on 27 October at the $80,000 support level. This suggests another move towards the 82,300 level.
The price formed the inverted head and shoulders pattern in June and July 2026. Then the price broke above 67,000 which suggests a positive structure in Bitcoin.
Gold Price Forecast
Every new Gold analysis as it publishes, today's technical signal and key levels, live price — on one page.
See all Gold forecastsBitcoin-to-Gold Ratio: Bullish Base Supports Further Upside
The current strength in Bitcoin is also observed from the ratio of Bitcoin to gold (XAU). The ratio produced a low in February 2026 within the ascending channel pattern. After marking this low, the ratio has produced strong rebound within this channel to push up near the 20 level.
The positive structure in the rebound from this ascending channel suggests that the ratio can move towards the 35 level. But a break above the 35 level will likely open the way for further upside.
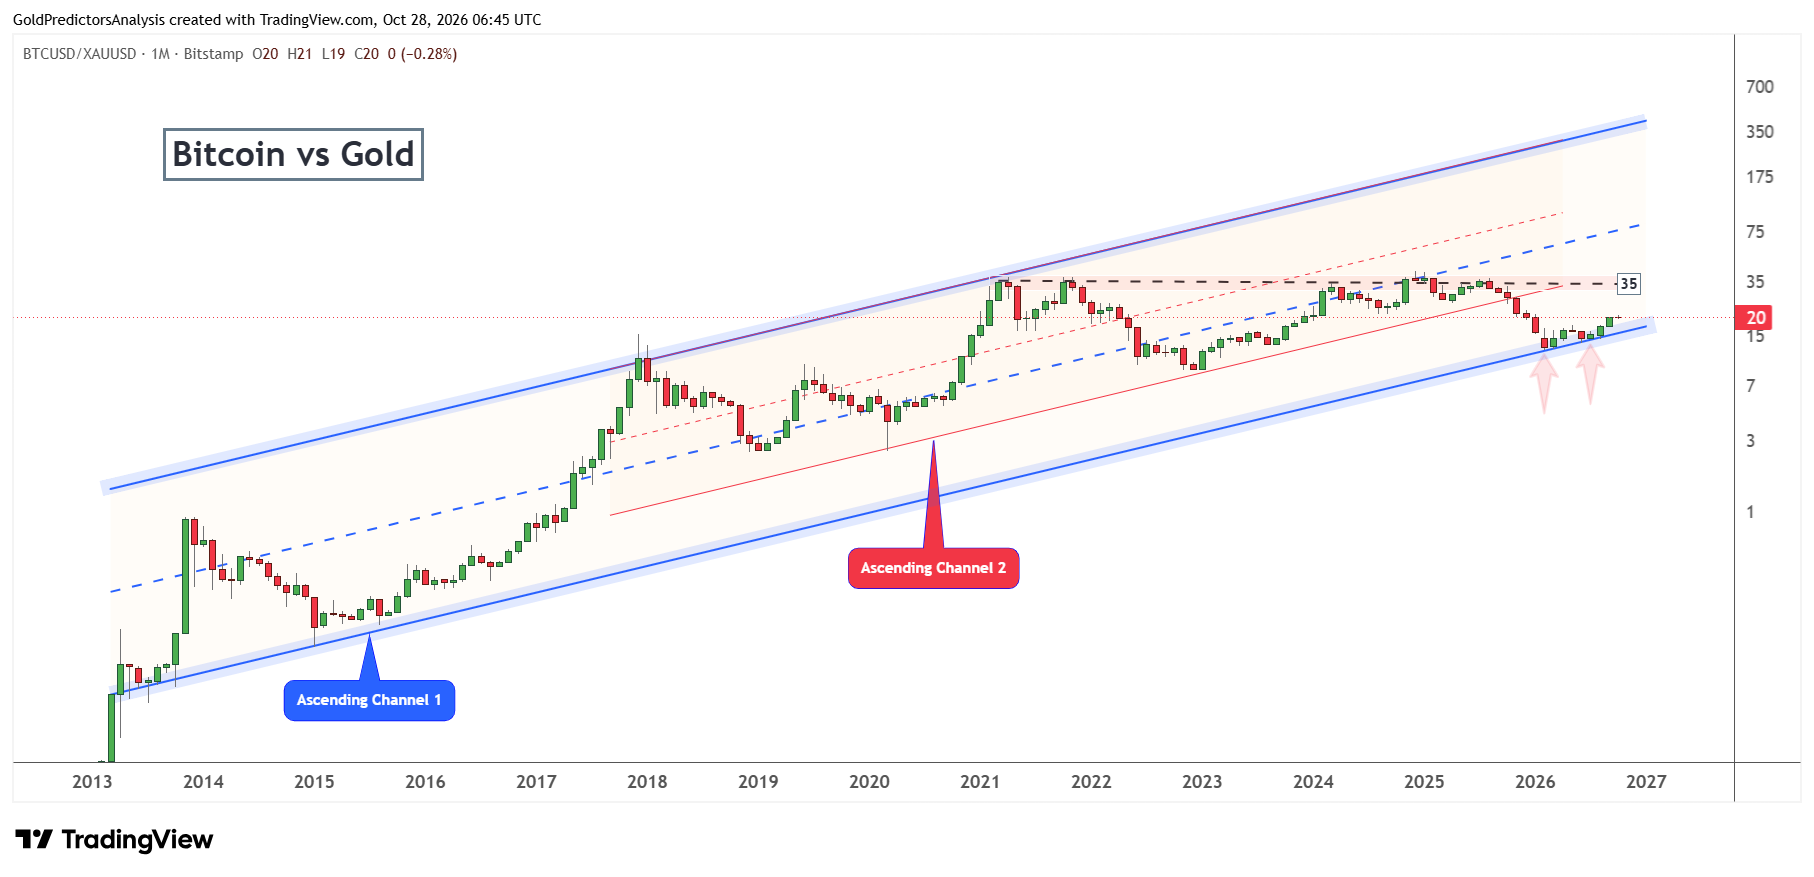
The weekly chart for the Bitcoin to gold ratio also shows constructive price action. This constructive price action is observed with the head and shoulders formation in 2022 and then the bullish base with higher second low in August 2026. The ratio broke the 18 level in August 2026 and now looks for further upside.
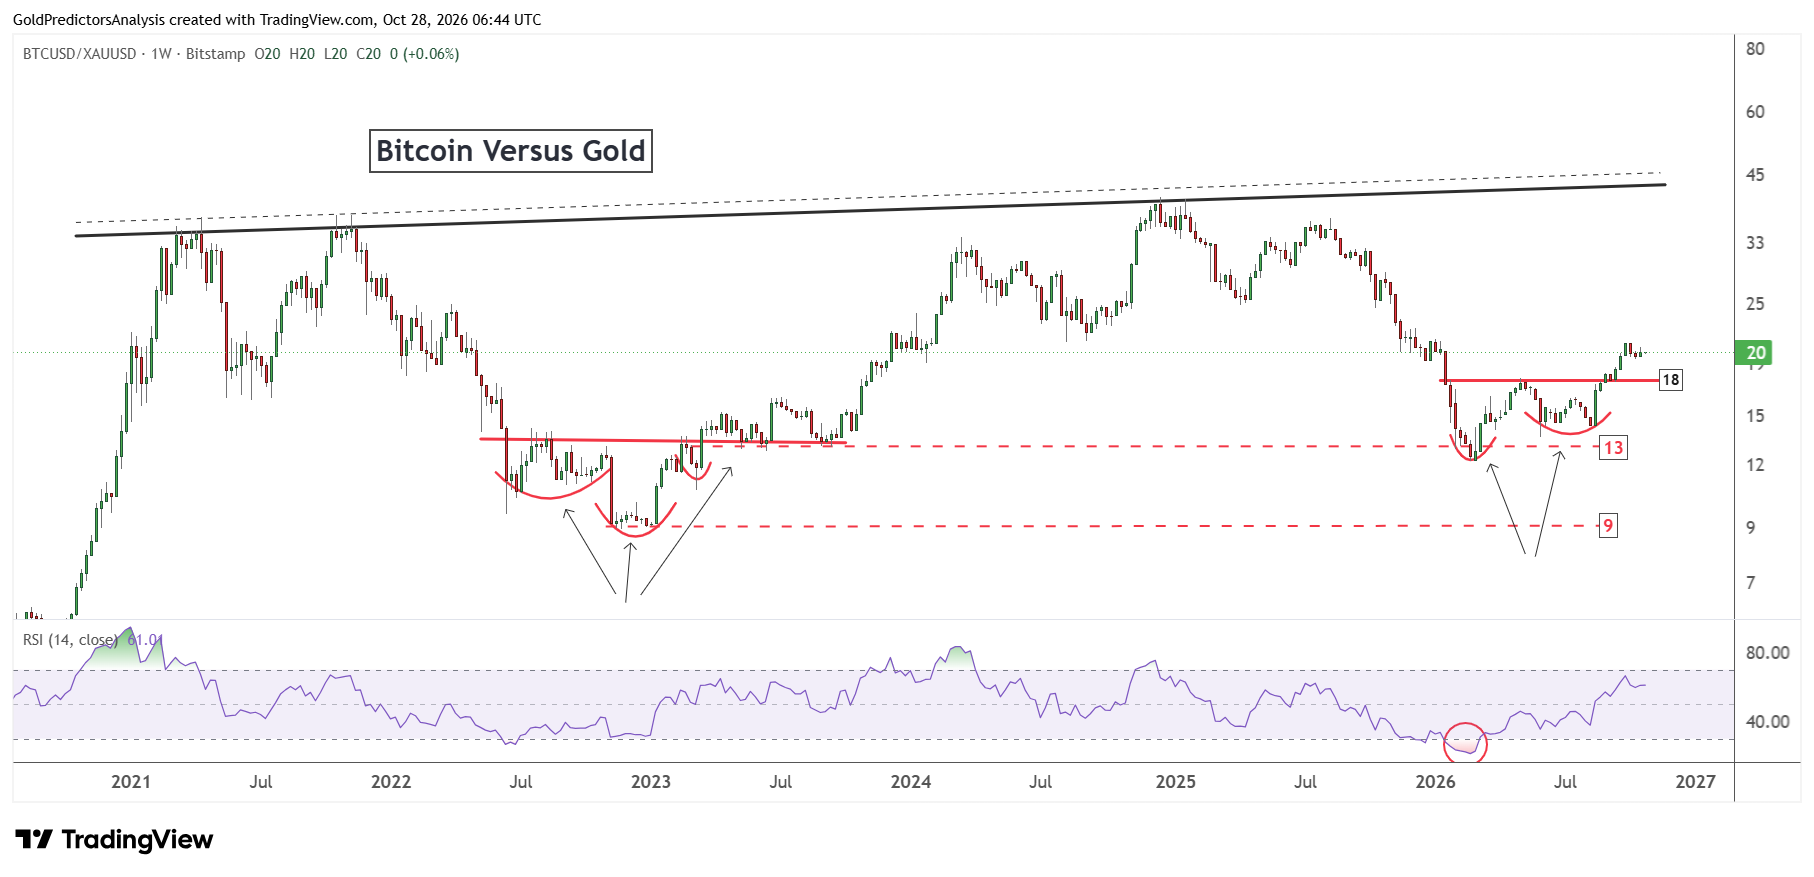
As long as the Bitcoin to gold ratio remains above the 18 level, the outlook for Bitcoin against gold may remain positive. But a break below the 18 level in the ratio may signal weaker performance against gold in the short term.
Bottom Line
The market is now watching for the Federal Reserve decision on Wednesday. The market expects the Fed to keep rates unchanged in October, but it will watch for signals about interest rates in future.
A break above the $87,200 level in Bitcoin will likely open the way for further upside to the $100,000 area. A break above $100,000 will push the price towards the long-term resistance in the $150,000 region.
I think that Bitcoin still holds the bullish structure as long as the price remains above $60,000. The ratio of Bitcoin to gold must remain above the 18 level to maintain the bullish outlook in the short term.
Read more: Break Above $87,200 Could Target $100,000