


Rebound Signals Emerging Demand
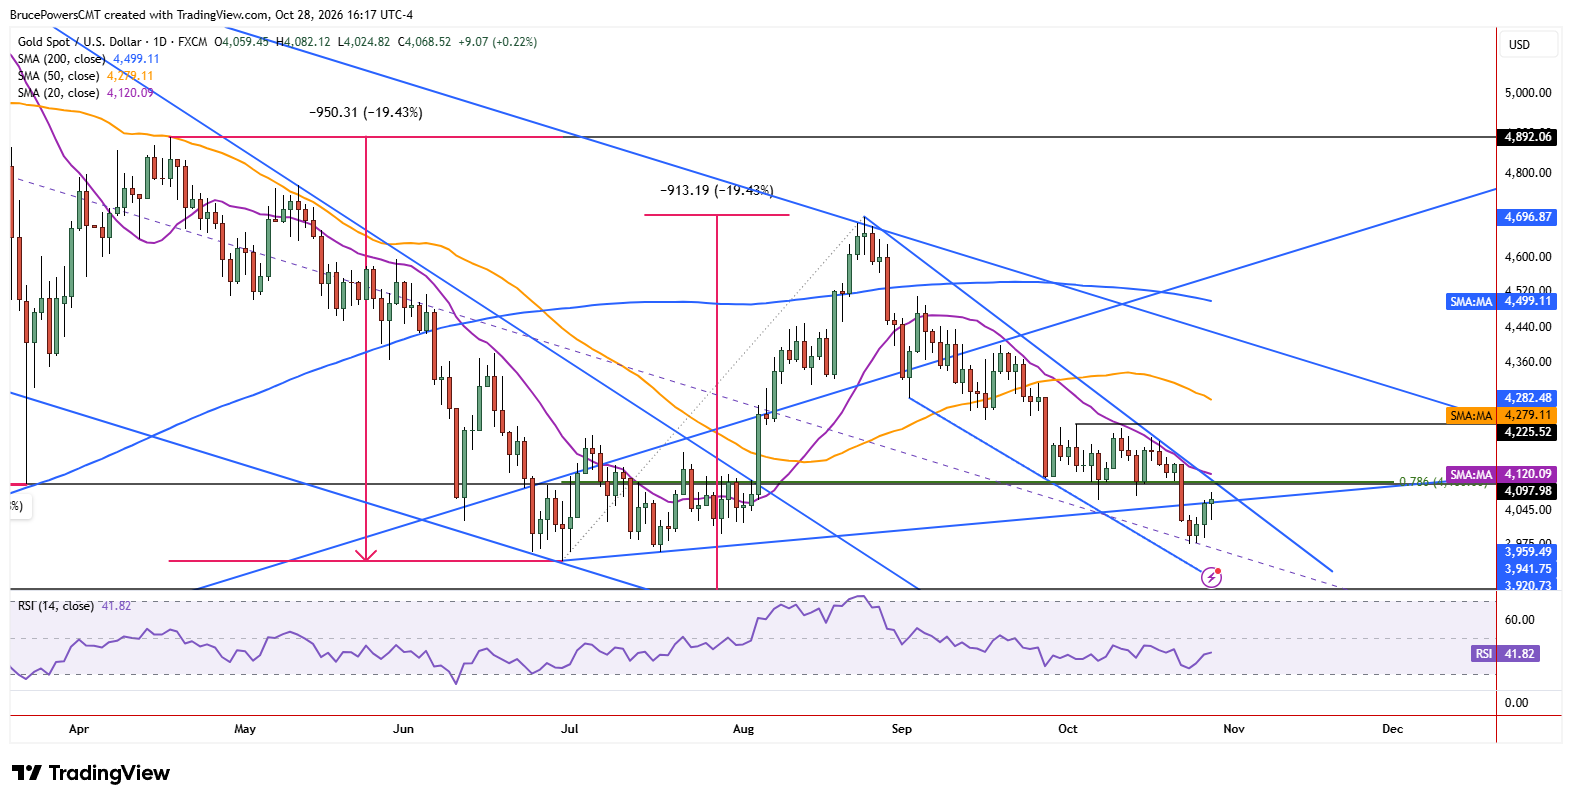
Gold tested resistance near a rising trendline for the second day on Wednesday, hitting a slightly higher high of $4,082 and a higher daily low of $4,028. The relatively narrow-range day held in the upper half of Tuesday’s session, indicating relatively sustained demand following Tuesday’s bullish reversal day. This suggests the bounce from new trend lows could extend above to Wednesday’s high and reach higher resistance levels.
Converging Trendlines Set Up a Key Test
However, there is no indication that Tuesday’s rally is more than a reaction to the selling that preceded it. Sellers are clearly in control overall, and the bearish trend is expected to continue unless signs of strength begin to appear. A clearer signal could emerge soon as the downtrend line and uptrend line converge over the next few days. A break above the downtrend line would signal short-term strength requiring further confirmation. Alternatively, resistance could persist below the converging trendlines, reinforcing the bearish structure.
Resistance Overhead, $3,975 Pivot Below
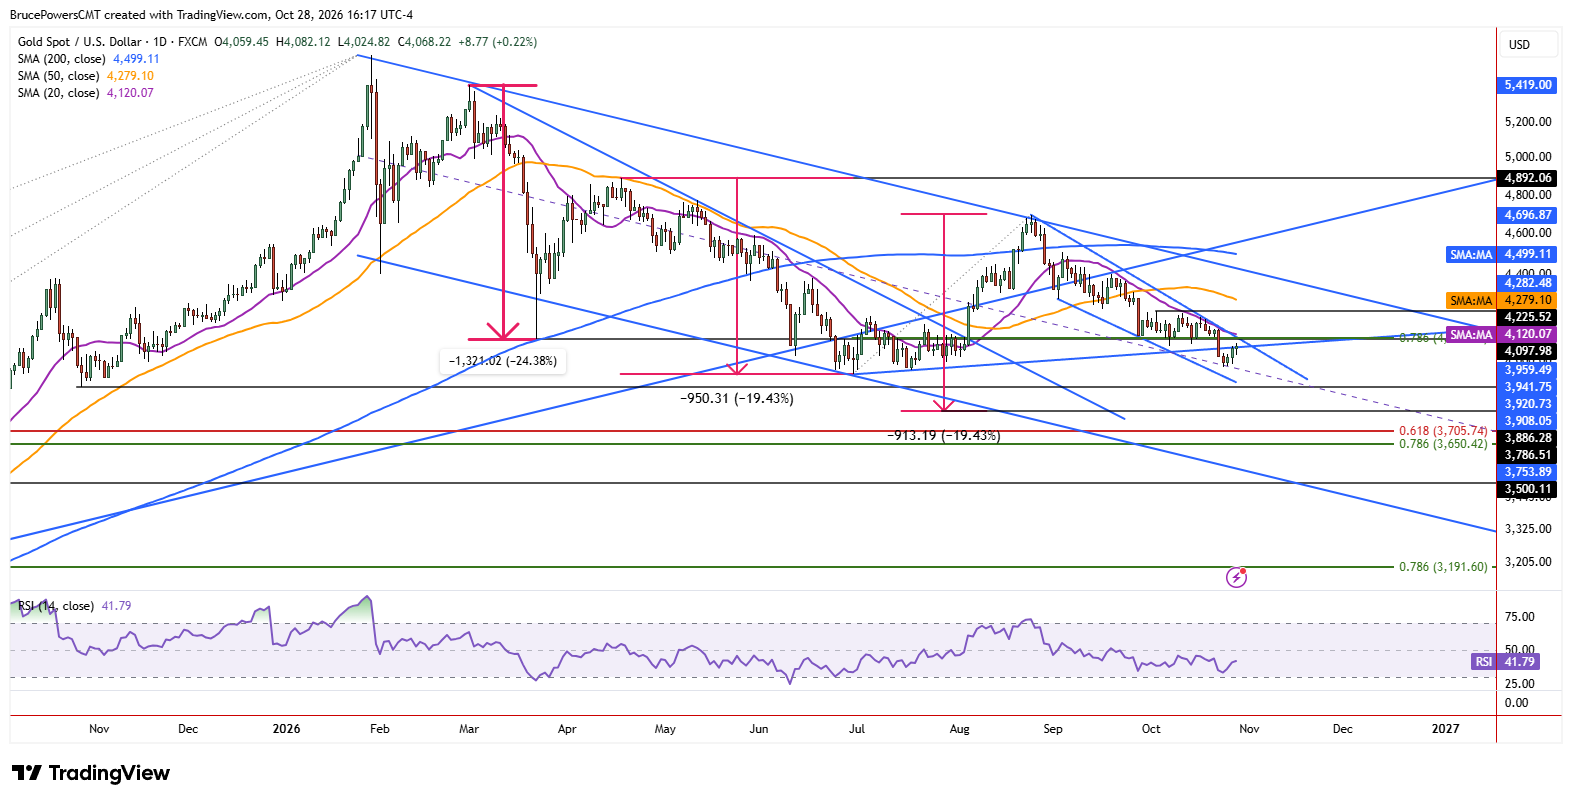
A breakout above Wednesday’s high could lead to a test of resistance near the recent support zone around $4,101, followed by the 20-day moving average near $4,118 and falling. So far, although gold’s trend is bearish suggesting further downside, the price remains above the higher swing low from June at $3,942 and may continue to do so. A sustained reclaim of the 20-day moving average would show improving demand and raise the potential to reverse the short-term downtrend. Until then, a break above the downtrend line would be a positive development, but it would not typically provide a reliable reversal signal on its own.
Last week’s low of $3,975 is a key pivot since a drop below it will extend the bearish trend and increase the potential for a move below the June low. If that occurs, potential support levels include a measured move at $2,786, a Fibonacci retracement levels from $3,706 to $3,645, and a prior high of $3,500. Therefore, while gold’s recent bounce offers an early sign of demand, the outlook remains bearish until stronger technical evidence emerges. Holding above $3,975 and reclaiming the 20-day moving average would help shift that outlook; a breakdown below $3,975 would instead increase the risk of a test of the June low at $3,942 and potentially lower support.
If you’d like to know more about how to trade gold and silver, please visit our educational area.