



Gold and Silver News: Lower Yields Support Demand as Payrolls Loom
Spot gold trades near $4,140 per troy ounce and spot silver near $53.07 per troy ounce. Gold and silver gained support Thursday as the dollar and Treasury yields eased following the Democratic victory in the US midterm elections, Reuters reported. Yields are the returns investors receive on bonds; lower yields can make metals, which pay no interest, more attractive. A softer dollar also makes dollar-priced metals cheaper for overseas buyers. Even so, expectations of further Federal Reserve tightening remain a constraint on the recovery.
Friday’s US employment report is the next test for that outlook. The Bureau of Labor Statistics schedules the October figures for November 6. Strong hiring or wage growth could reinforce expectations for higher rates, while weaker data could ease them. The metals recovery therefore still depends partly on whether incoming data support the fall in yields.
Gold: Central Banks and ETFs Offset Weaker Retail Demand
The World Gold Council’s November 3 report shows central banks purchased a net 321 tonnes in the third quarter, up 42% from a year earlier. The council identifies portfolio diversification and risk management as the main reasons for official buying. Physically backed exchange-traded funds, investment products traded on exchanges and backed by gold, added 211 tonnes. Their holdings reached a record 4,256 tonnes.
Retail buying moved in the other direction. Bar-and-coin purchases fell 19% year over year, while jewellery consumption declined 17% as high prices limited affordability. Central-bank buying and ETF inflows provide support, but those flows have not translated into stronger household purchases. That leaves gold relying more heavily on official-sector and investment demand.
Silver: Industrial Demand Limits the Monetary Tailwind
Silver benefits from the same weaker dollar and lower yields, but industrial use adds another demand test. In its October 22 assessment, WisdomTree cited Metals Focus’s forecast for industrial silver demand to fall approximately 3% to 640mn ounces in 2026. This remains a forecast, rather than a completed annual result.
Solar manufacturers are reducing the amount of silver used in each application and substituting other materials where feasible. Automotive electrification and AI infrastructure provide support, but they have not removed the pressure from weaker solar demand. Improved investment interest can help silver recover, although stronger manufacturing activity alone may not produce an equal increase in metal consumption.
Gold Price Forecast
Every new Gold analysis as it publishes, today's technical signal and key levels, live price — on one page.
See all Gold forecastsGold Technical Analysis: Channel Breakout Faces $4,146 Resistance
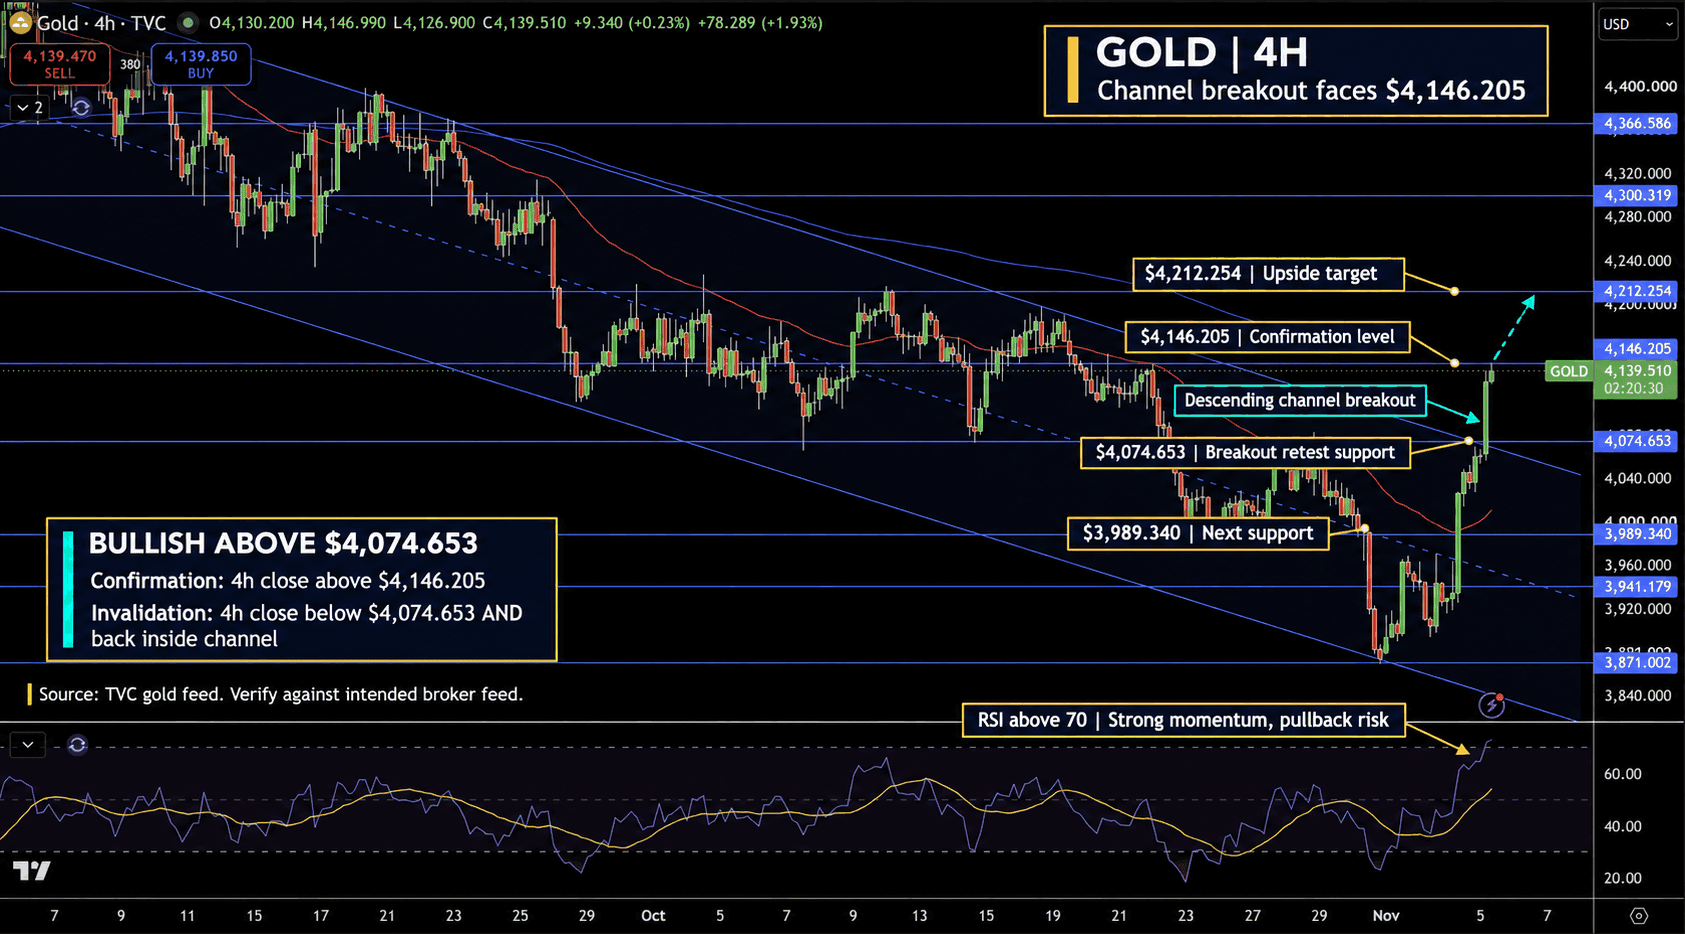
Gold trades near $4,140 per troy ounce on the four-hour TVC chart, above the red moving average and the upper boundary of its descending channel. The current candle briefly traded above $4,146 before slipping back below resistance.
A four-hour close above $4,146 would open the way for $4,212. Initial support, where buyers may step in, is $4,075 near the broken channel boundary, followed by $3,989. RSI, a 0 to 100 gauge of buying and selling strength, has crossed above 70, showing strong momentum with greater pullback risk. I remain bullish above $4,075 and favor a successful breakout retest. A four-hour close below that level and back inside the channel would invalidate the immediate bullish setup.
Silver Technical Analysis: Recovery Tests Falling Channel Near $53.07
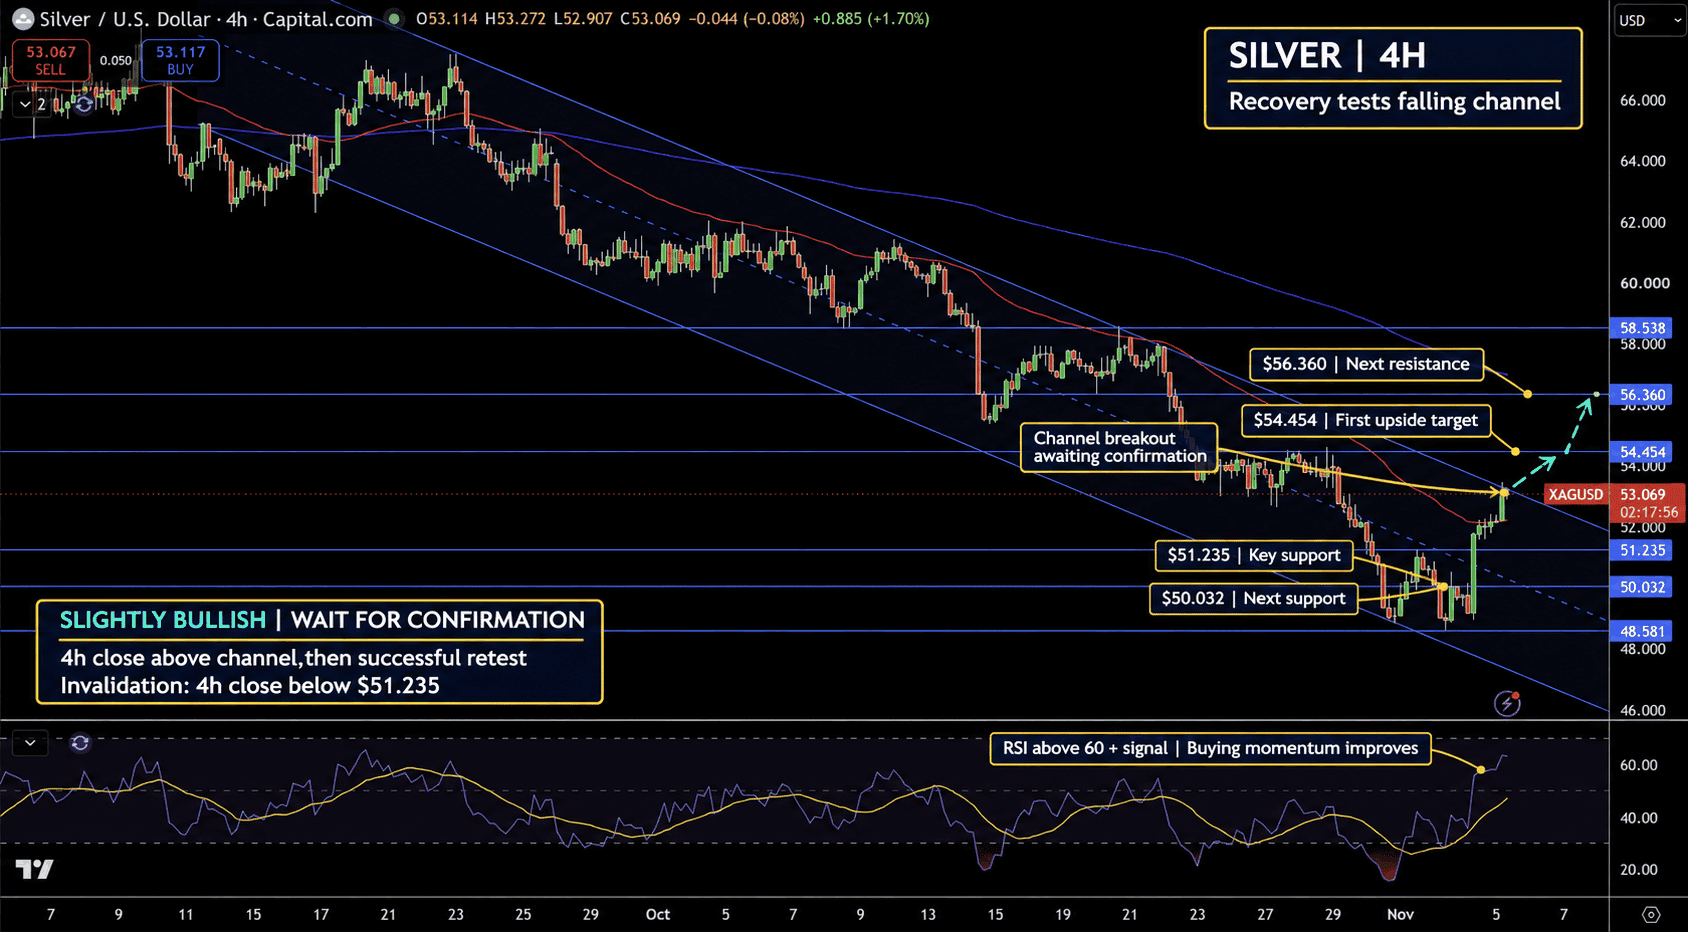
Silver trades near $53.07 per troy ounce on the four-hour Capital.com chart after reclaiming the red moving average. Buyers are testing the descending channel’s upper boundary. The latest small candle shows hesitation there, so the recovery still needs a confirmed break above the channel.
A successful breakout would bring $54.45 resistance into focus, followed by $56.36. Support stands at $51.24, then $50.03 if the rebound loses strength. RSI has climbed above 60 and its signal line, a slower average of RSI, supporting improving momentum. I lean slightly bullish but would wait for a four-hour close above the channel and a successful retest. A close below $51.24 would invalidate the immediate recovery setup.