



Gold Bounces From One-Year Low but Heads for Weekly Loss
Gold rose on Friday as bargain hunters returned after prices hit their lowest level since October 2025 on Thursday, but the metal was still on track for a weekly decline, Reuters reported. Spot gold climbed 1.1% to $3,918.59 by 05:18 GMT, and investors now turn to US producer price data due at 13:30 GMT.
Gold: Oversold, Not Out of the Woods
On Thursday, oil prices rose on fading hopes for peace in the Middle East, which revived fears of higher inflation and elevated interest rates, Reuters said. Separately, New York Fed President John Williams said on Thursday that more rate hikes are likely. Gold pays no interest, so higher rates raise the cost of holding it.
OANDA’s Kelvin Wong called Friday’s rebound “more of a positioning adjustment” after several short-term momentum indicators hit extreme oversold levels, meaning prices had fallen very fast. “A short-term driver that could be bullish for gold will be a sudden turn of the US Treasury yield,” he said, adding that it would potentially slow down the US dollar. Markets price an 89% chance of a quarter-point Fed hike in December and an 11% chance of a half-point move, according to CME’s FedWatch tool, which turns futures prices into rate odds.
What Still Supports Gold
Official buying is still providing support. Central banks bought 321 tonnes of gold in the third quarter, 42% more than a year earlier, the World Gold Council’s Gold Demand Trends report shows, and China’s central bank added about 25.8 tonnes in October, official data showed, its largest monthly increase since September 2023, according to market tracker Wind Info. In my view, that buying slows the declines but cannot reverse them while Fed hike bets keep rising.
Silver: Lagging the Rebound
Spot silver rose 0.5% to $50.27 on Friday but was headed for a weekly decline, and palladium was also on track for a weekly loss, Reuters said. Platinum was the exception, heading for a modest weekly gain. Silver’s bounce has also been smaller than gold’s. In my view, that shows buyers remain cautious about a metal tied closely to industrial demand.
Gold Price Forecast
Every new Gold analysis as it publishes, today's technical signal and key levels, live price — on one page.
See all Gold forecastsGold Technical Analysis: XAU/USD Bounces From $3,852 but Stays Below $3,903
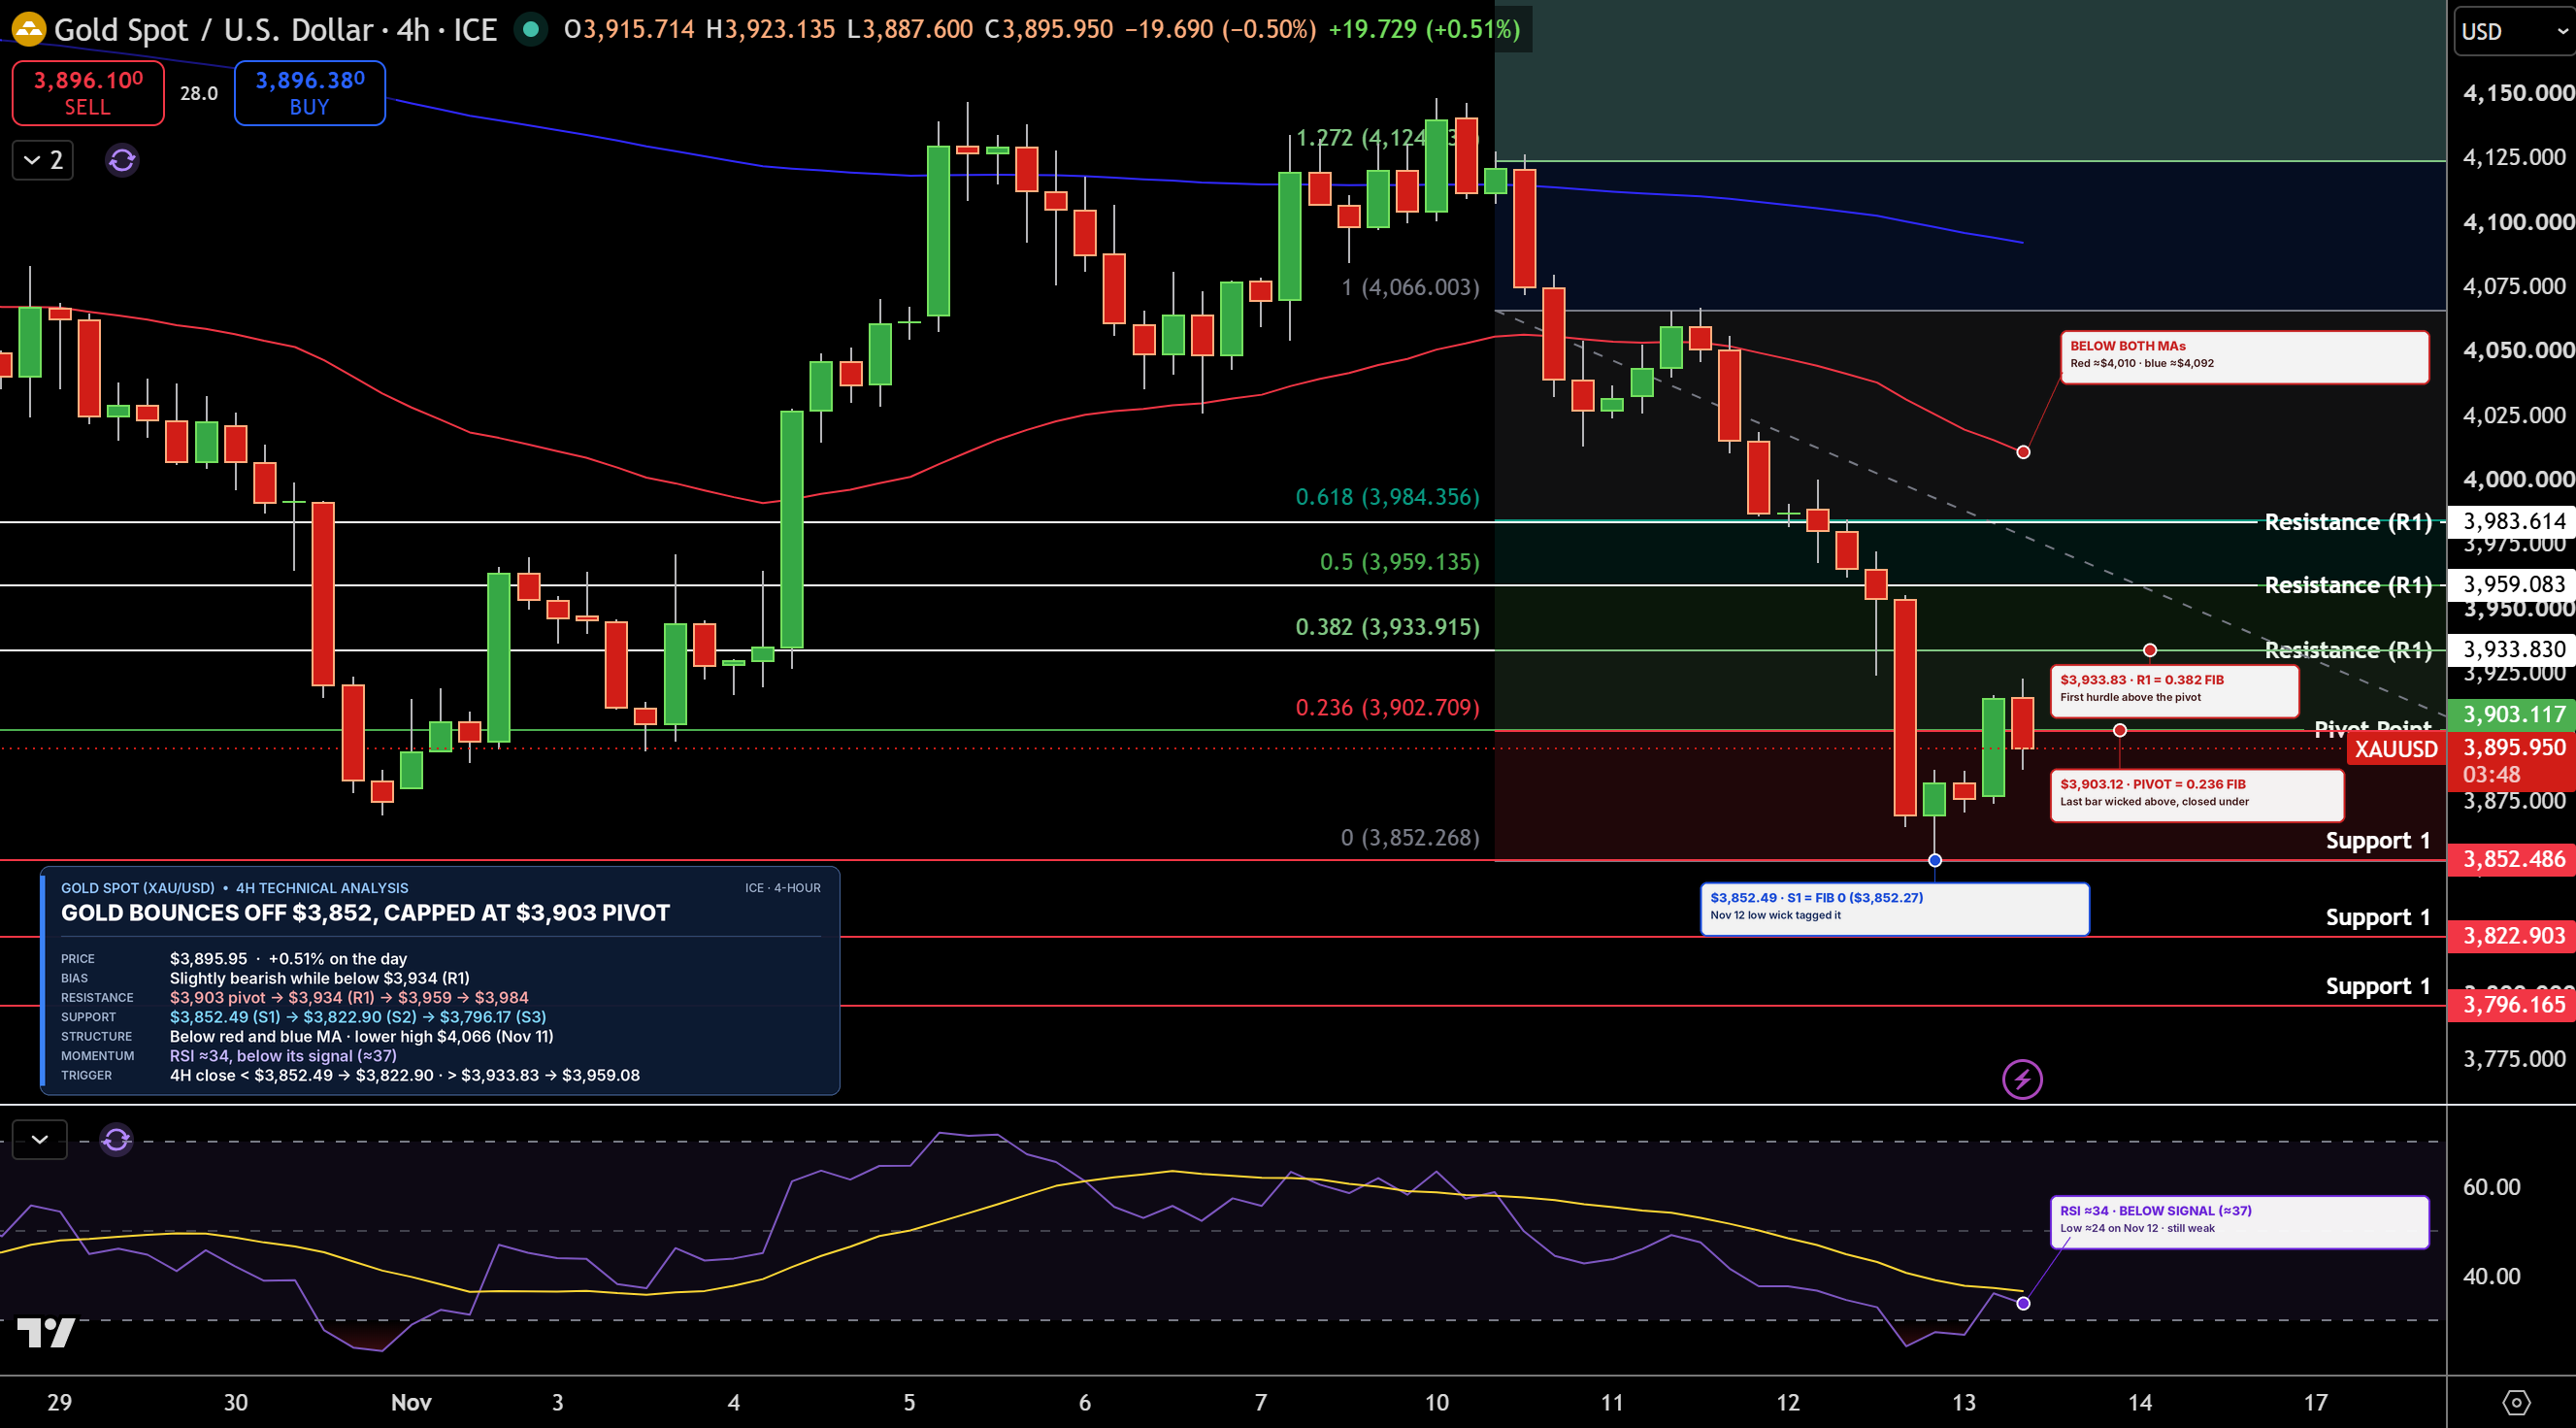
Gold is trading near $3,896 on the 4-hour chart. Buyers stepped in at $3,852, but the bounce has stalled near $3,903, the pivot point, a level calculated from the previous period’s high, low and close that traders use to judge direction. Gold remains below both moving averages, which track average prices over time, after a lower high near $4,066 on November 11.
Resistance, where sellers may return, is $3,903, then $3,934, a Fibonacci retracement level that shows how much of the drop has been recovered. Support, where buyers may step in, is $3,852, then $3,823. RSI, a 0 to 100 gauge of buying and selling strength, is near 34 and below its signal line, a slower average of RSI. I lean slightly bearish while gold stays below $3,934. A close below $3,852 would open $3,823.
Silver Technical Analysis: XAG/USD Tests $49.67 Support After Trendline Rejection
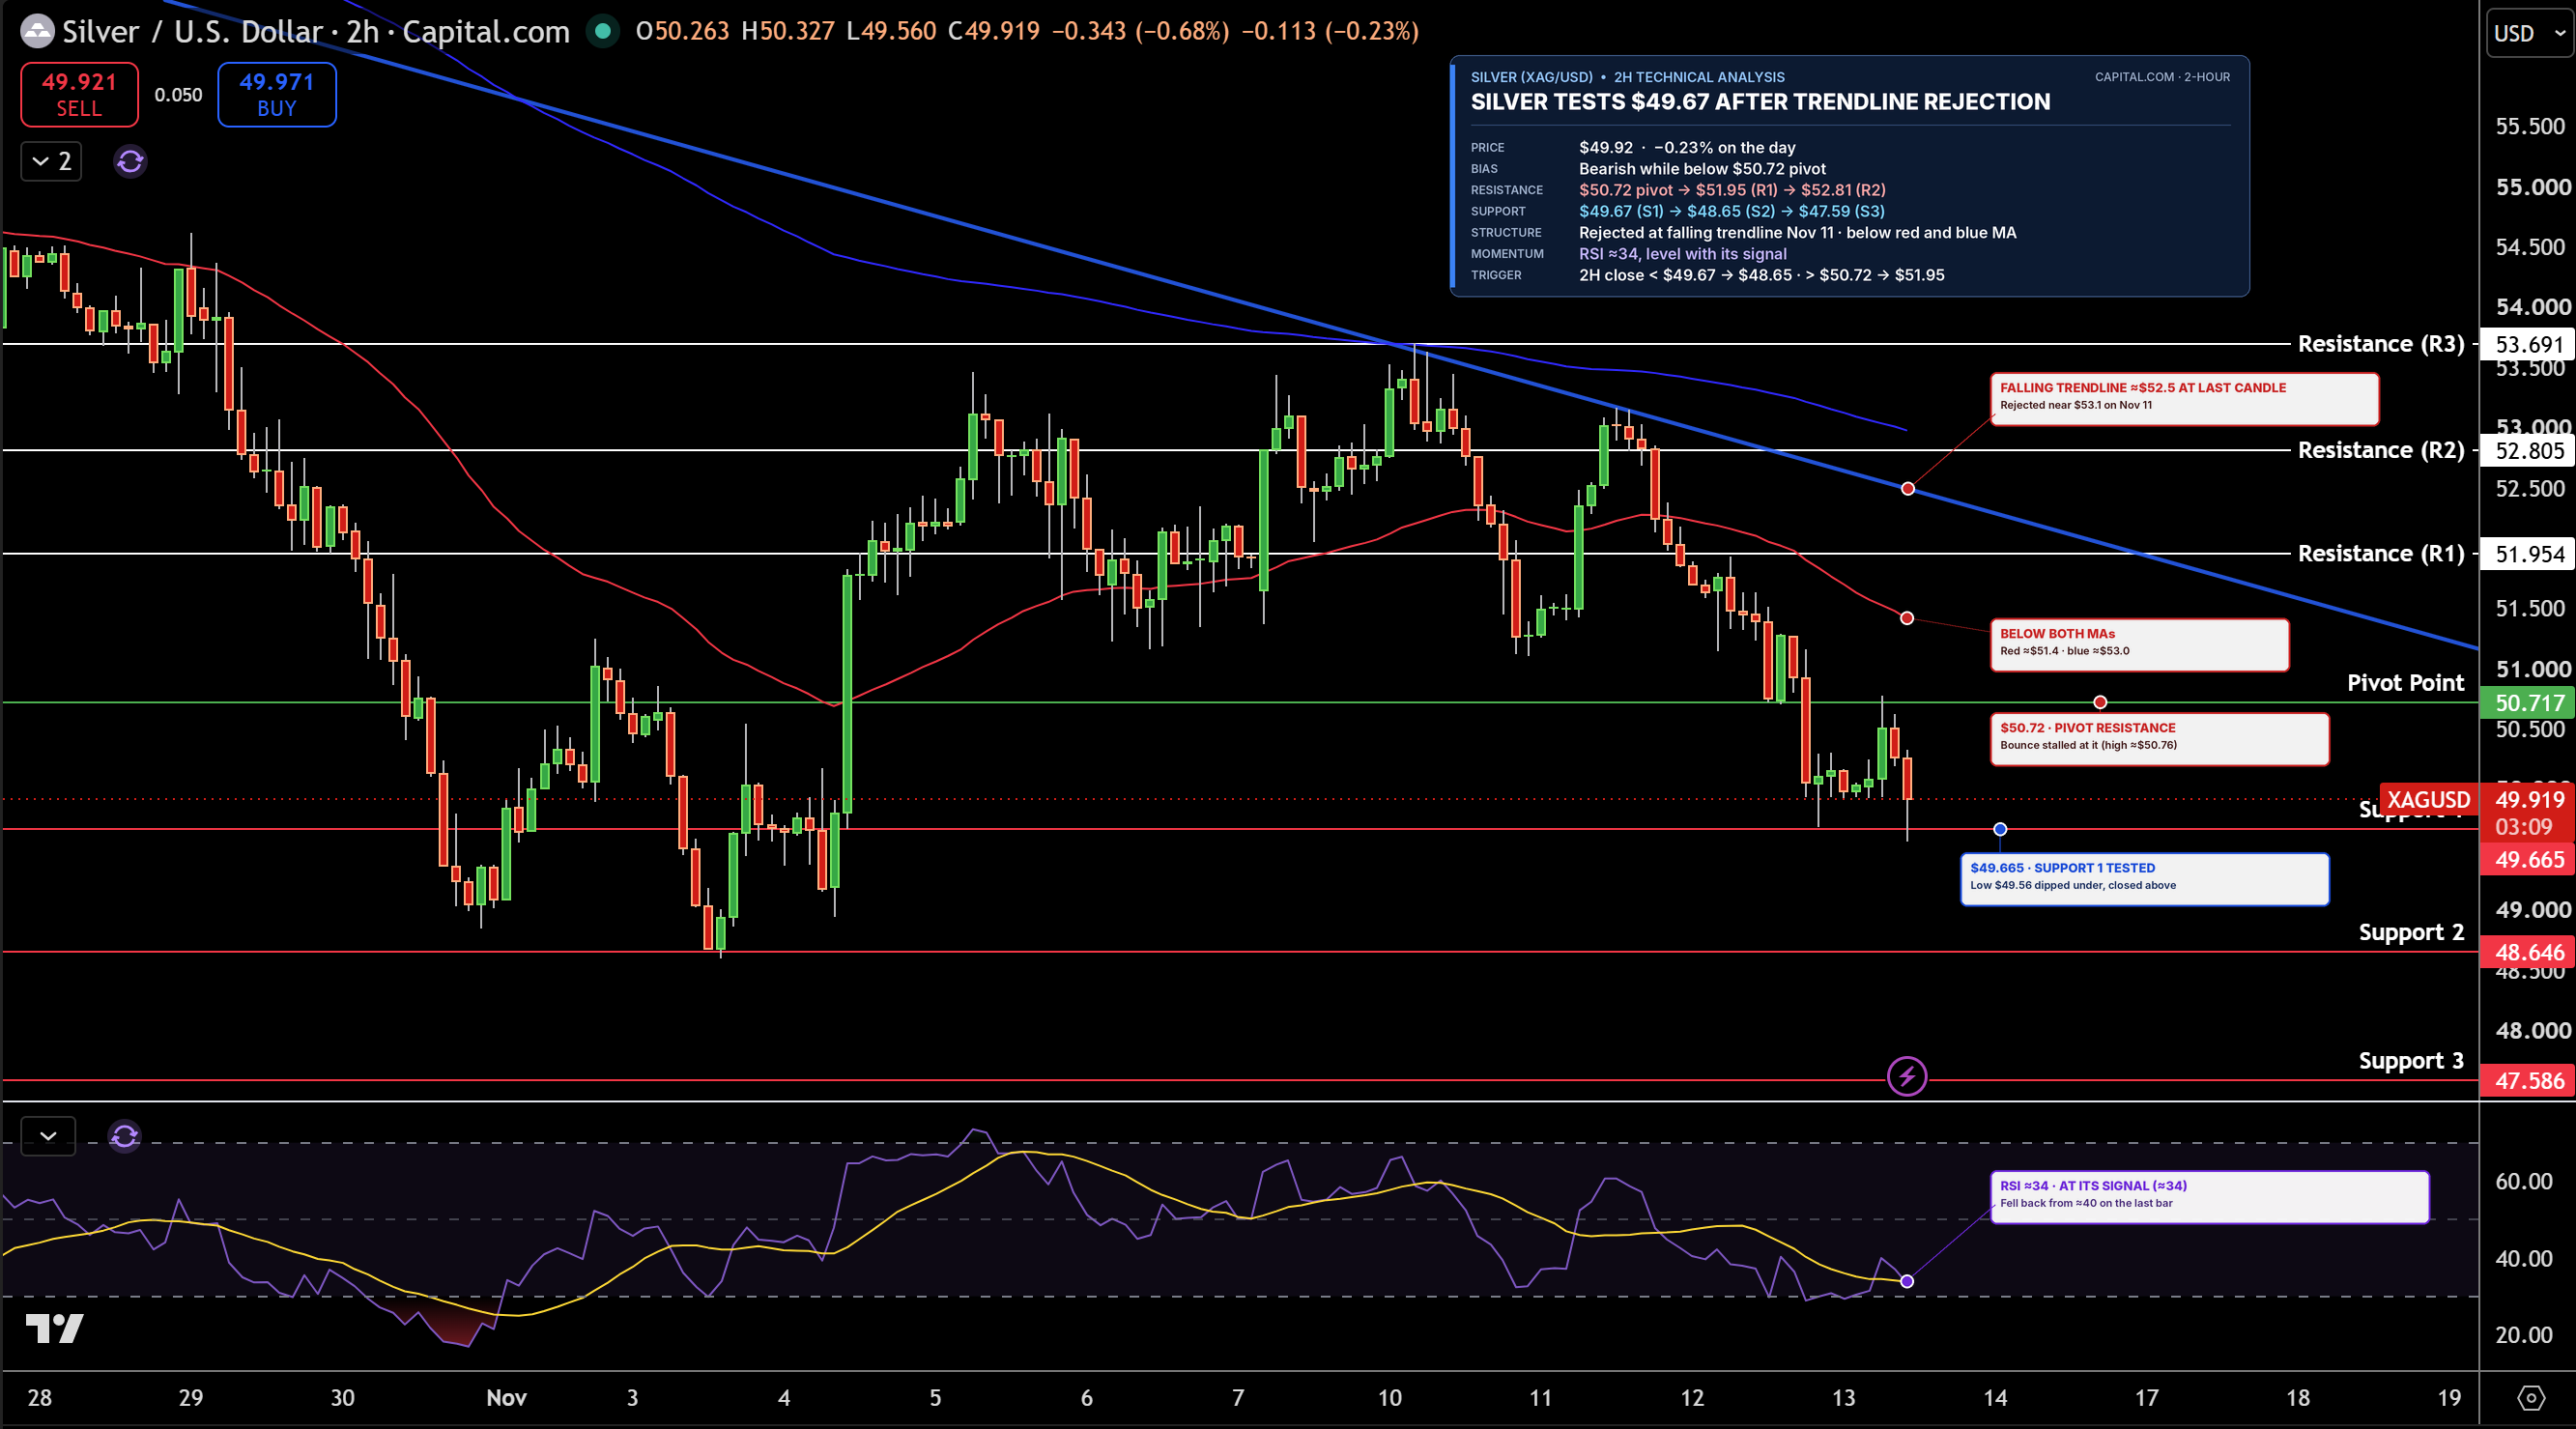
Silver is trading near $49.92 on the 2-hour chart. Sellers turned prices back near $53 on November 11 at a falling trendline, a line connecting lower highs. Silver has since dropped below its $50.72 pivot, is now testing $49.67 and sits below both moving averages.
Support is $49.67, then $48.65. Resistance is $50.72, then $51.95. RSI is near 34 and level with its signal line, so selling pressure is easing but has not reversed. The bias stays bearish while silver trades below $50.72, and a close below $49.67 would open $48.65.