


Hot Inflation Report Raises Odds of a Jumbo Fed Hike
Gold edged higher on Wednesday after a nearly 3% slide in the previous session, when US inflation came in hotter than expected and Fed policymakers signaled a willingness to tighten more aggressively. Spot gold was up 0.3% at $4,043.62 by 03:03 GMT, CNBC reported, and silver recovered part of its losses.
Gold: CPI Surprise Hits Hard
Consumer prices rose 0.4% in October, above the 0.3% economists expected in a Reuters poll, the Bureau of Labor Statistics said. Core CPI, which leaves out food and energy, rose 0.3%, the same pace as in August and September. Gasoline rose 1%, motor vehicle insurance 0.7% and hospital services 0.8%. The BLS did not publish a 12-month rate for the overall index because it did not collect survey data for October 2025 during a lapse in appropriations, so there is no year-earlier index to compare with.
Fed officials leaned hawkish. Governor Christopher Waller had said he would support more aggressive action if the CPI report was too hot, Reuters reported. Philadelphia Fed President Anna Paulson said further gradual tightening seems appropriate. Traders now treat a quarter-point December hike as fully priced, and the chance of a half-point move rose to 10% from zero before the data, according to CME’s FedWatch tool, which turns futures prices into rate odds.
Treasury yields climbed and the dollar strengthened, which hurts gold because it pays no interest and is priced in dollars. Gold still held above $4,000, which Standard Chartered called “the critical $4,000/oz mark.” Producer price data follow on Friday.
Support Beneath the Selloff
Official buying continues to provide a floor. China’s central bank added about 25.8 tonnes of gold in October, official data showed, its largest monthly increase since September 2023, according to market tracker Wind Info. In my view, that buying helps explain why gold found support near $4,000 even after a hotter-than-expected inflation report.
Gold Price Forecast
Every new Gold analysis as it publishes, today's technical signal and key levels, live price — on one page.
See all Gold forecastsSilver: Tracks Gold Lower, Then Bounces
Spot silver fell 3.95% to $51.30 on Tuesday, while platinum lost 2.7% and palladium 1.2%, Reuters reported. On Wednesday, silver climbed 1.7% to $52.38 and palladium gained 1.3%, CNBC reported. In my view, silver’s heavy industrial use adds a growth worry on top of the rate pressure when the Fed turns more hawkish, which is why it tends to fall harder than gold on hawkish news.
Gold Technical Analysis: XAU/USD Reclaims $4,051 Pivot as $4,088 Comes Into Focus
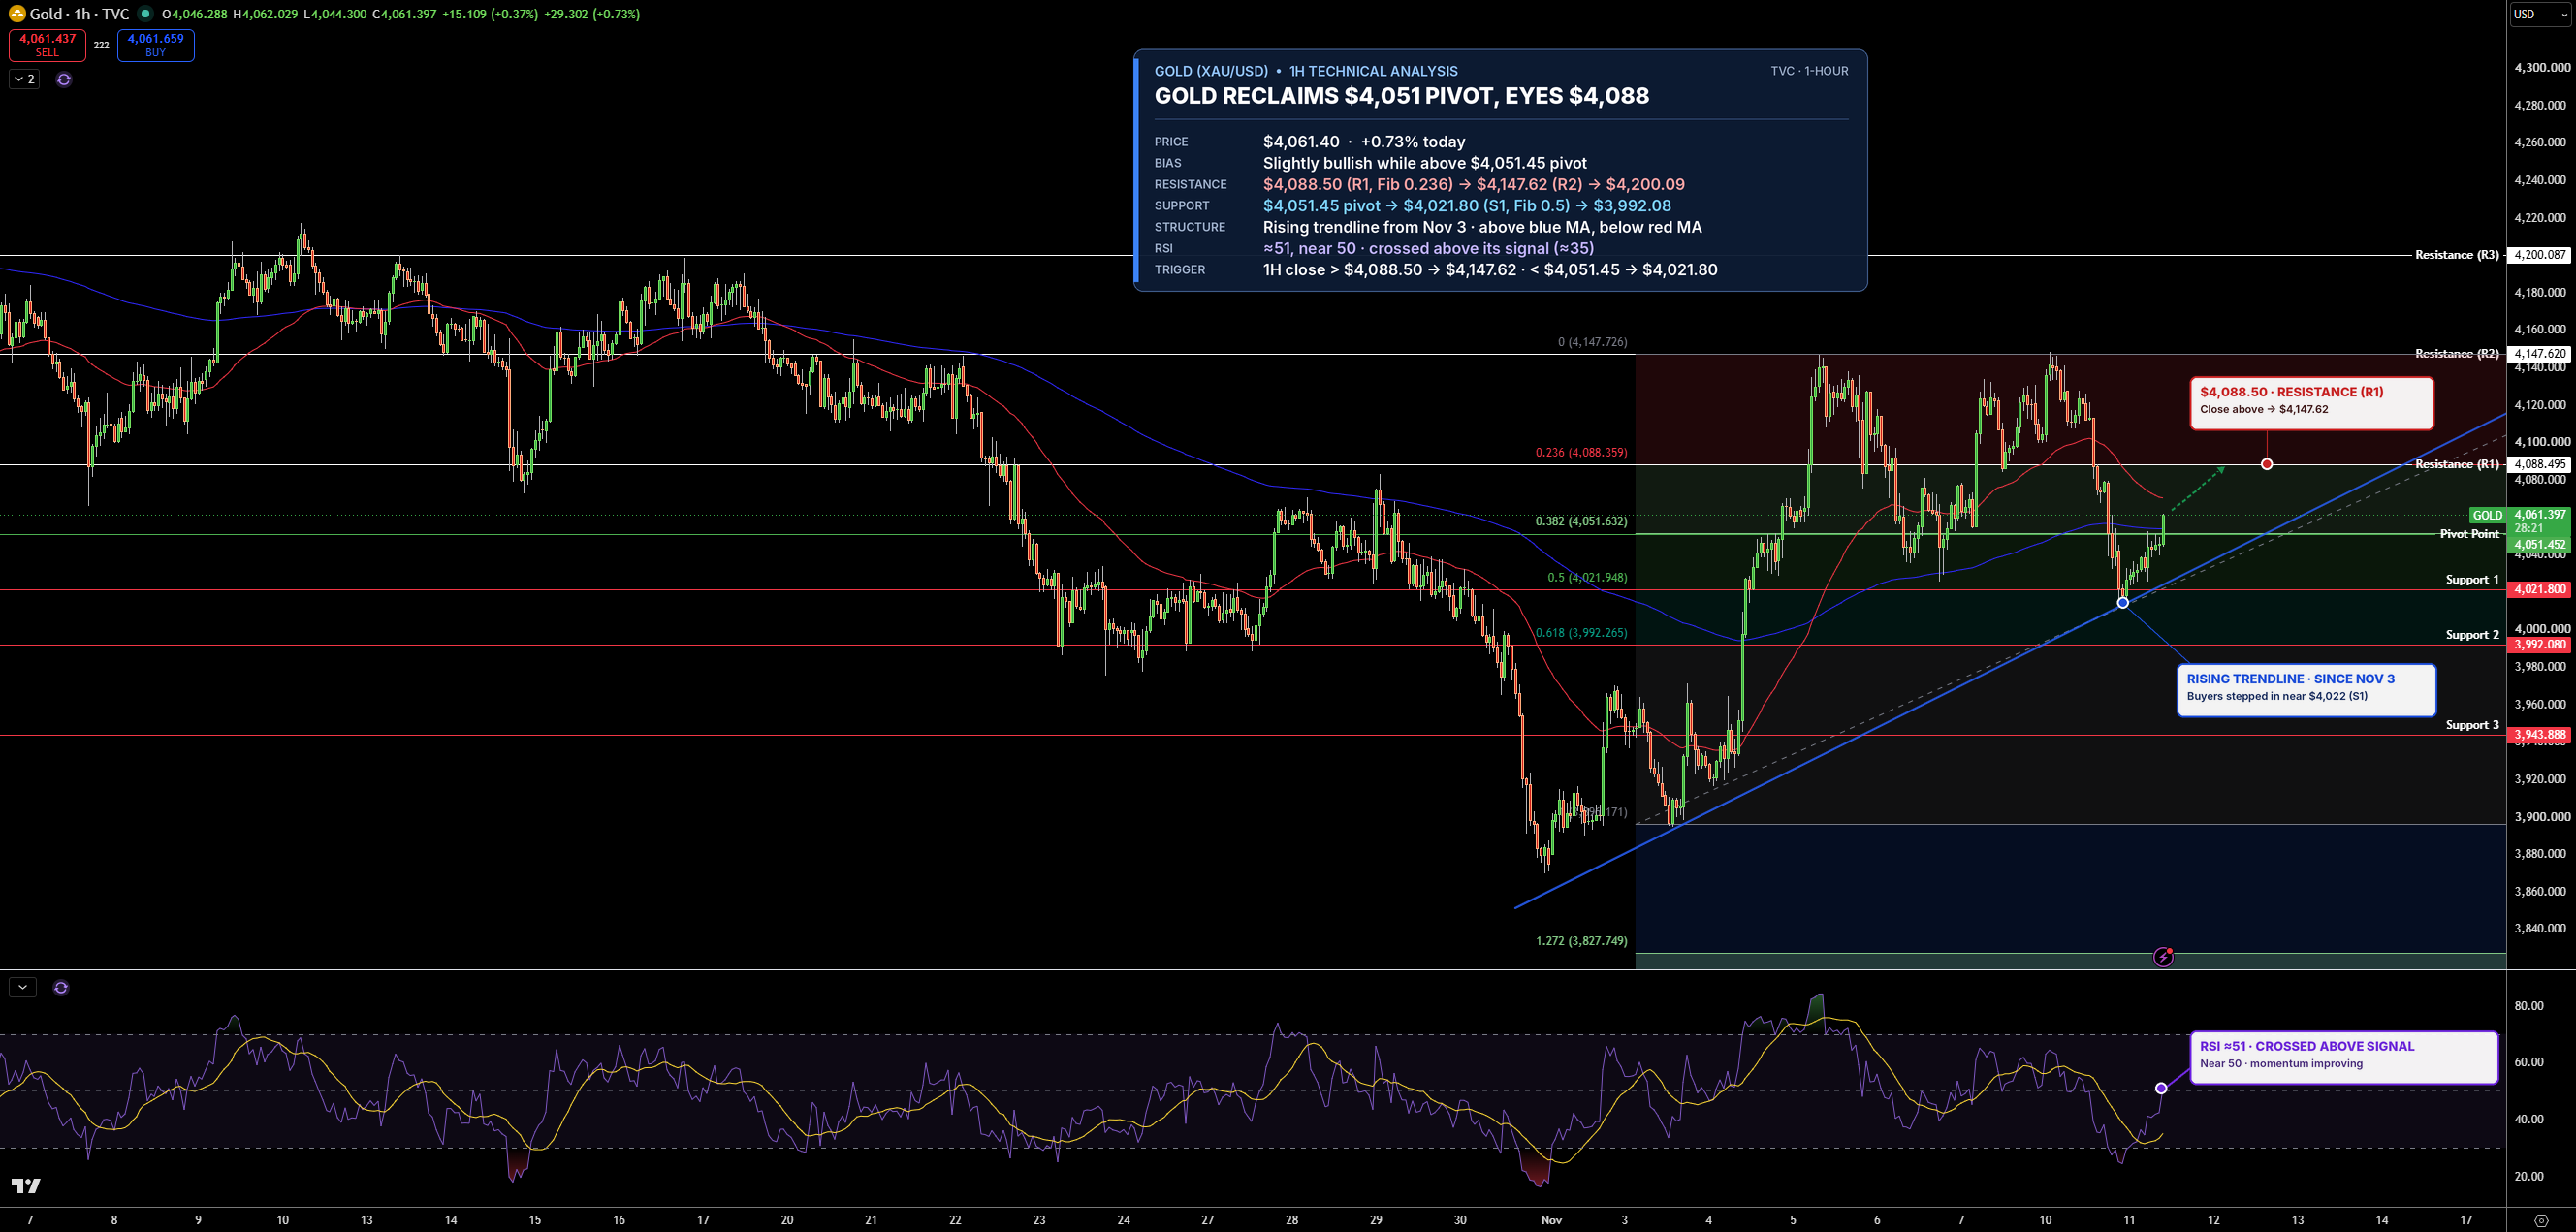
Gold is trading near $4,061 on the 1-hour chart. Buyers stepped in near $4,022, right at a rising trendline, a line connecting higher lows since November 3. Gold has climbed back above $4,051, the pivot point, a level calculated from the previous period’s high, low and close that traders use to judge direction, and above the slower moving average, which tracks the longer-term average price.
Resistance, where sellers may return, is $4,088, then $4,148. Support, where buyers may step in, is $4,051, then $4,022. RSI, a 0 to 100 gauge of buying and selling strength, has climbed to about 50 and crossed above its signal line, a slower average of RSI. I lean slightly bullish while gold holds $4,051. A close above $4,088 would open $4,148, while a drop below $4,022 would break the trendline.
Silver Technical Analysis: XAG/USD Bounces Above $52.12 as Triangle Breakout Nears
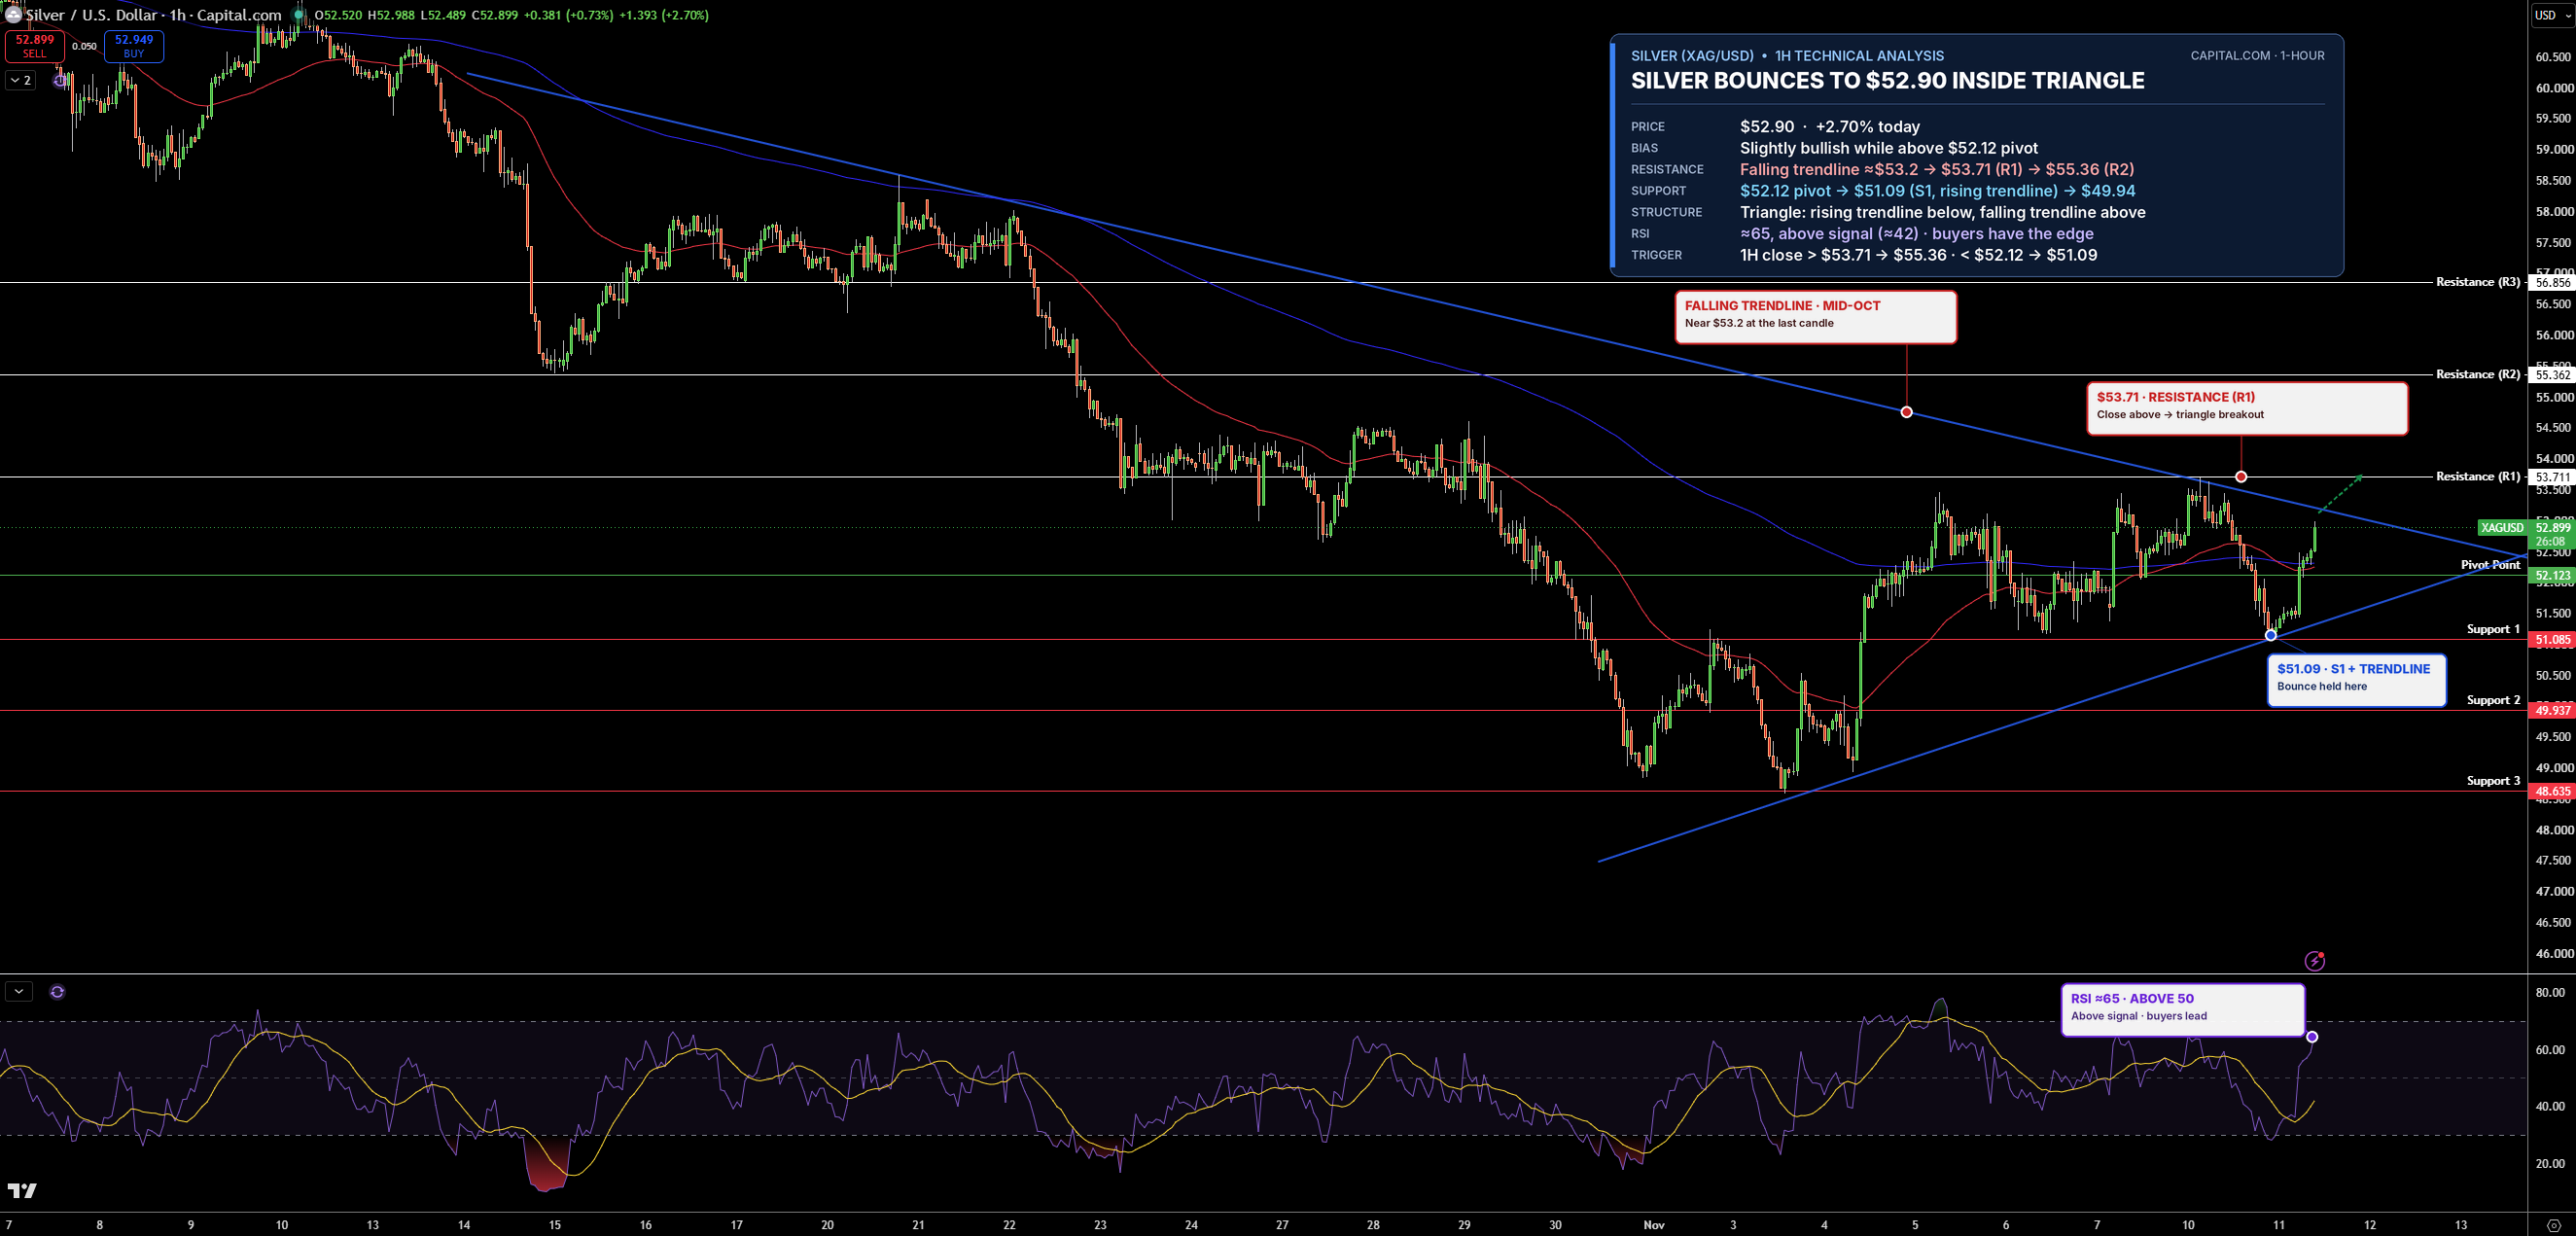
Silver is trading near $52.90 on the 1-hour chart. Prices bounced from $51.09 at a rising trendline and climbed back above $52.12, the pivot point. Silver is now inside a triangle, a pattern where price swings get smaller before a bigger move, with a falling trendline from mid-October capping it from above.
Resistance is $53.71, then $55.36. Support is $52.12, then $51.09. RSI is near 65 and rising, so buyers have the edge. The bias is a slight bullish lean while silver holds $52.12. A close above $53.71 would confirm a triangle breakout and open $55.36, while a drop below $51.09 would cancel it.