


Gold Gives Back Gains as Oil Rebound Revives Inflation Worries Before Fed
Gold eased on Wednesday after rising about 1% the previous session. A rebound in oil after a claimed strike on a Saudi refinery revived inflation concerns hours before the Fed’s decision, Reuters reported.
Gold: The Oil Link Cuts Both Ways
Tuesday’s rally came as falling energy prices eased fears of oil-driven inflation and further Fed tightening. That support reversed overnight once Houthi claims of a hit on Saudi Arabia’s Ras Tanura refinery lifted crude again, and spot gold slipped 0.3% to $4,045.29. The Fed announces its decision at 1800 GMT. Traders expect a hold, but CME’s FedWatch tool, which turns futures prices into rate odds, shows about an 84% chance of at least one hike by December, Reuters said. Higher rates hurt gold because it pays no interest.
The longer view has dimmed too. Analysts in a Reuters survey cut their 2026 gold forecast for a second straight quarter, to $4,495 an ounce, citing high Treasury yields, a strong dollar and expectations that rates stay higher for longer. They still expect a recovery in 2027, at $4,650. Platinum and palladium forecasts were cut for a third quarter in a row.
US Data: Strong Enough to Keep Hike Bets Alive
Tuesday’s data gave the Fed no reason to soften. The Conference Board’s consumer confidence index jumped to 91.7 in October from 84.2, well above forecasts near 81, helped by easing gasoline prices. Even so, consumers still voiced frustration over rising costs and planned less spending on services and durable goods, so the headline looks stronger than the mood behind it. September durable goods orders, which cover big-ticket items such as machinery and aircraft, rose 1.8%, while core capital goods orders, a proxy for business investment, gained 0.5%.
Silver: Industrial Exposure a Liability
Spot silver fell 0.6% to $54.06. Because about half of silver demand comes from industry, it is more exposed than gold to slower economic activity or higher borrowing costs. In India, both metals opened lower on Wednesday as traders also awaited Israel’s election results, Business Standard reported.
Gold Price Forecast
Every new Gold analysis as it publishes, today's technical signal and key levels, live price — on one page.
See all Gold forecastsGold Technical Analysis: XAU/USD Slips Below $4,039 After Trendline Rejection
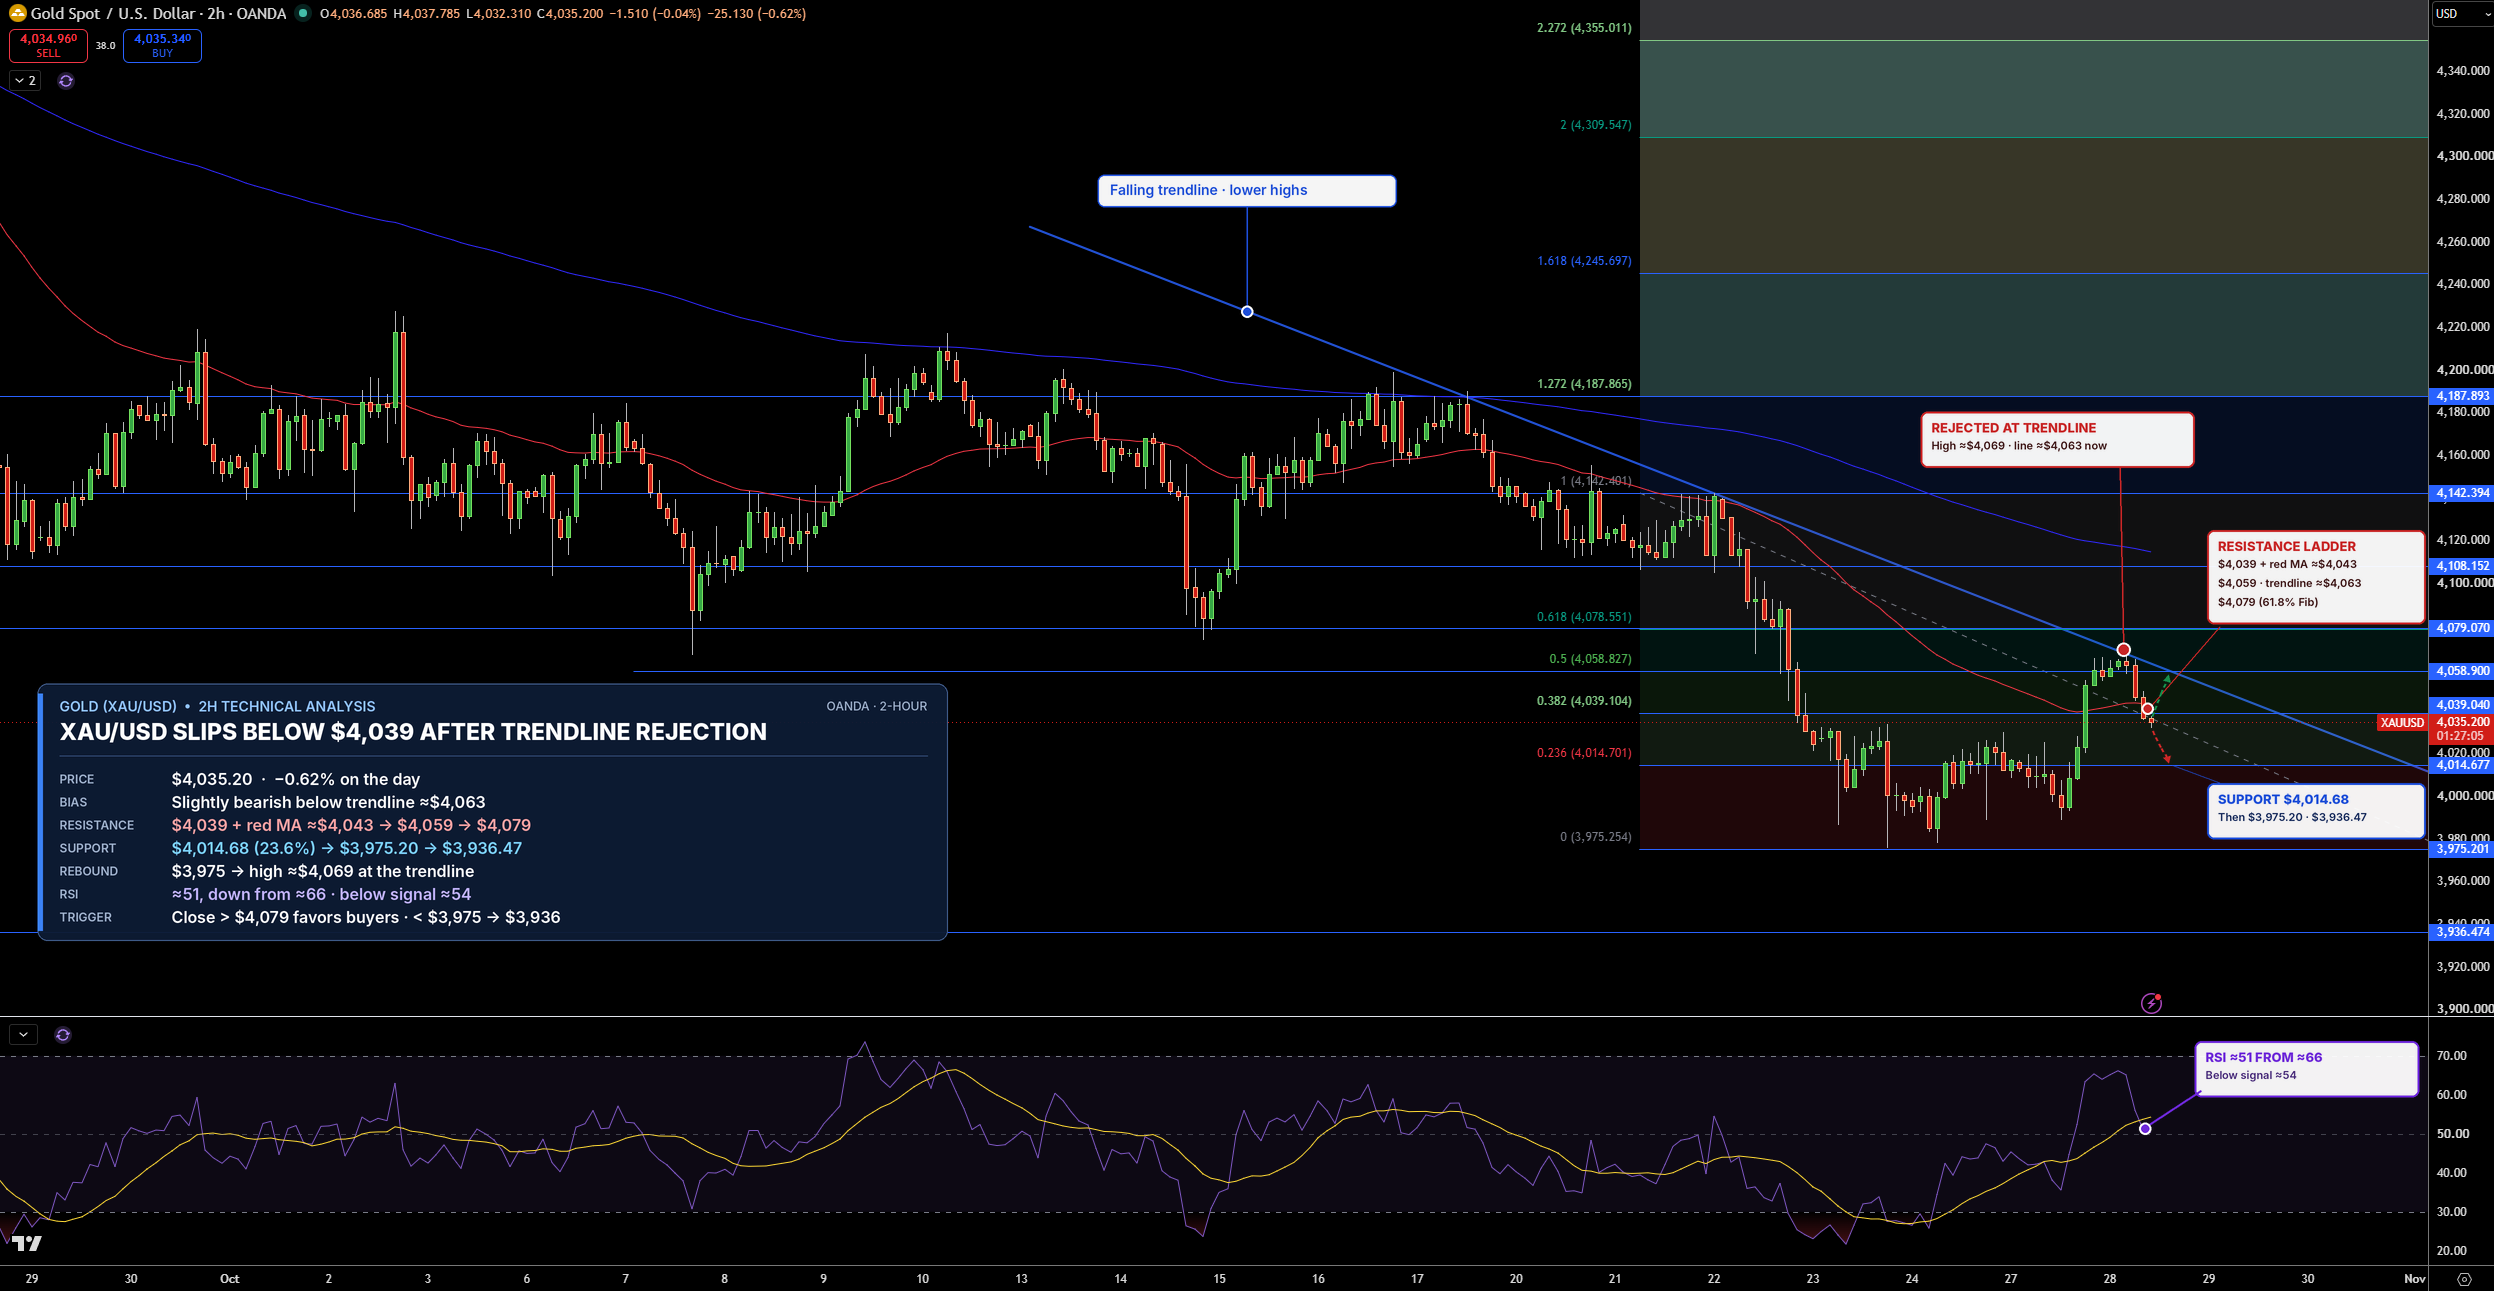
Gold is trading near $4,035 on the 2-hour chart, down about 0.6% today. Prices rebounded from $3,975 to near $4,069, then stalled at a falling trendline, a line connecting lower highs, which has capped every bounce since mid-October.
Support, where buyers tend to step in, is $4,015, then $3,975. Resistance, where sellers tend to step in, is $4,039, then $4,059 and $4,079. These are Fibonacci levels, which show how much of the drop has been recovered.
RSI, which measures the strength of recent buying and selling, has fallen from about 66 to near 51, so buying momentum is fading. I keep a slight bearish lean while gold stays below the trendline. A close above $4,079 would favor buyers, while a drop below $3,975 would point to $3,936.
Silver Technical Analysis: XAG/USD Rejected at $54.46 Inside Falling Channel
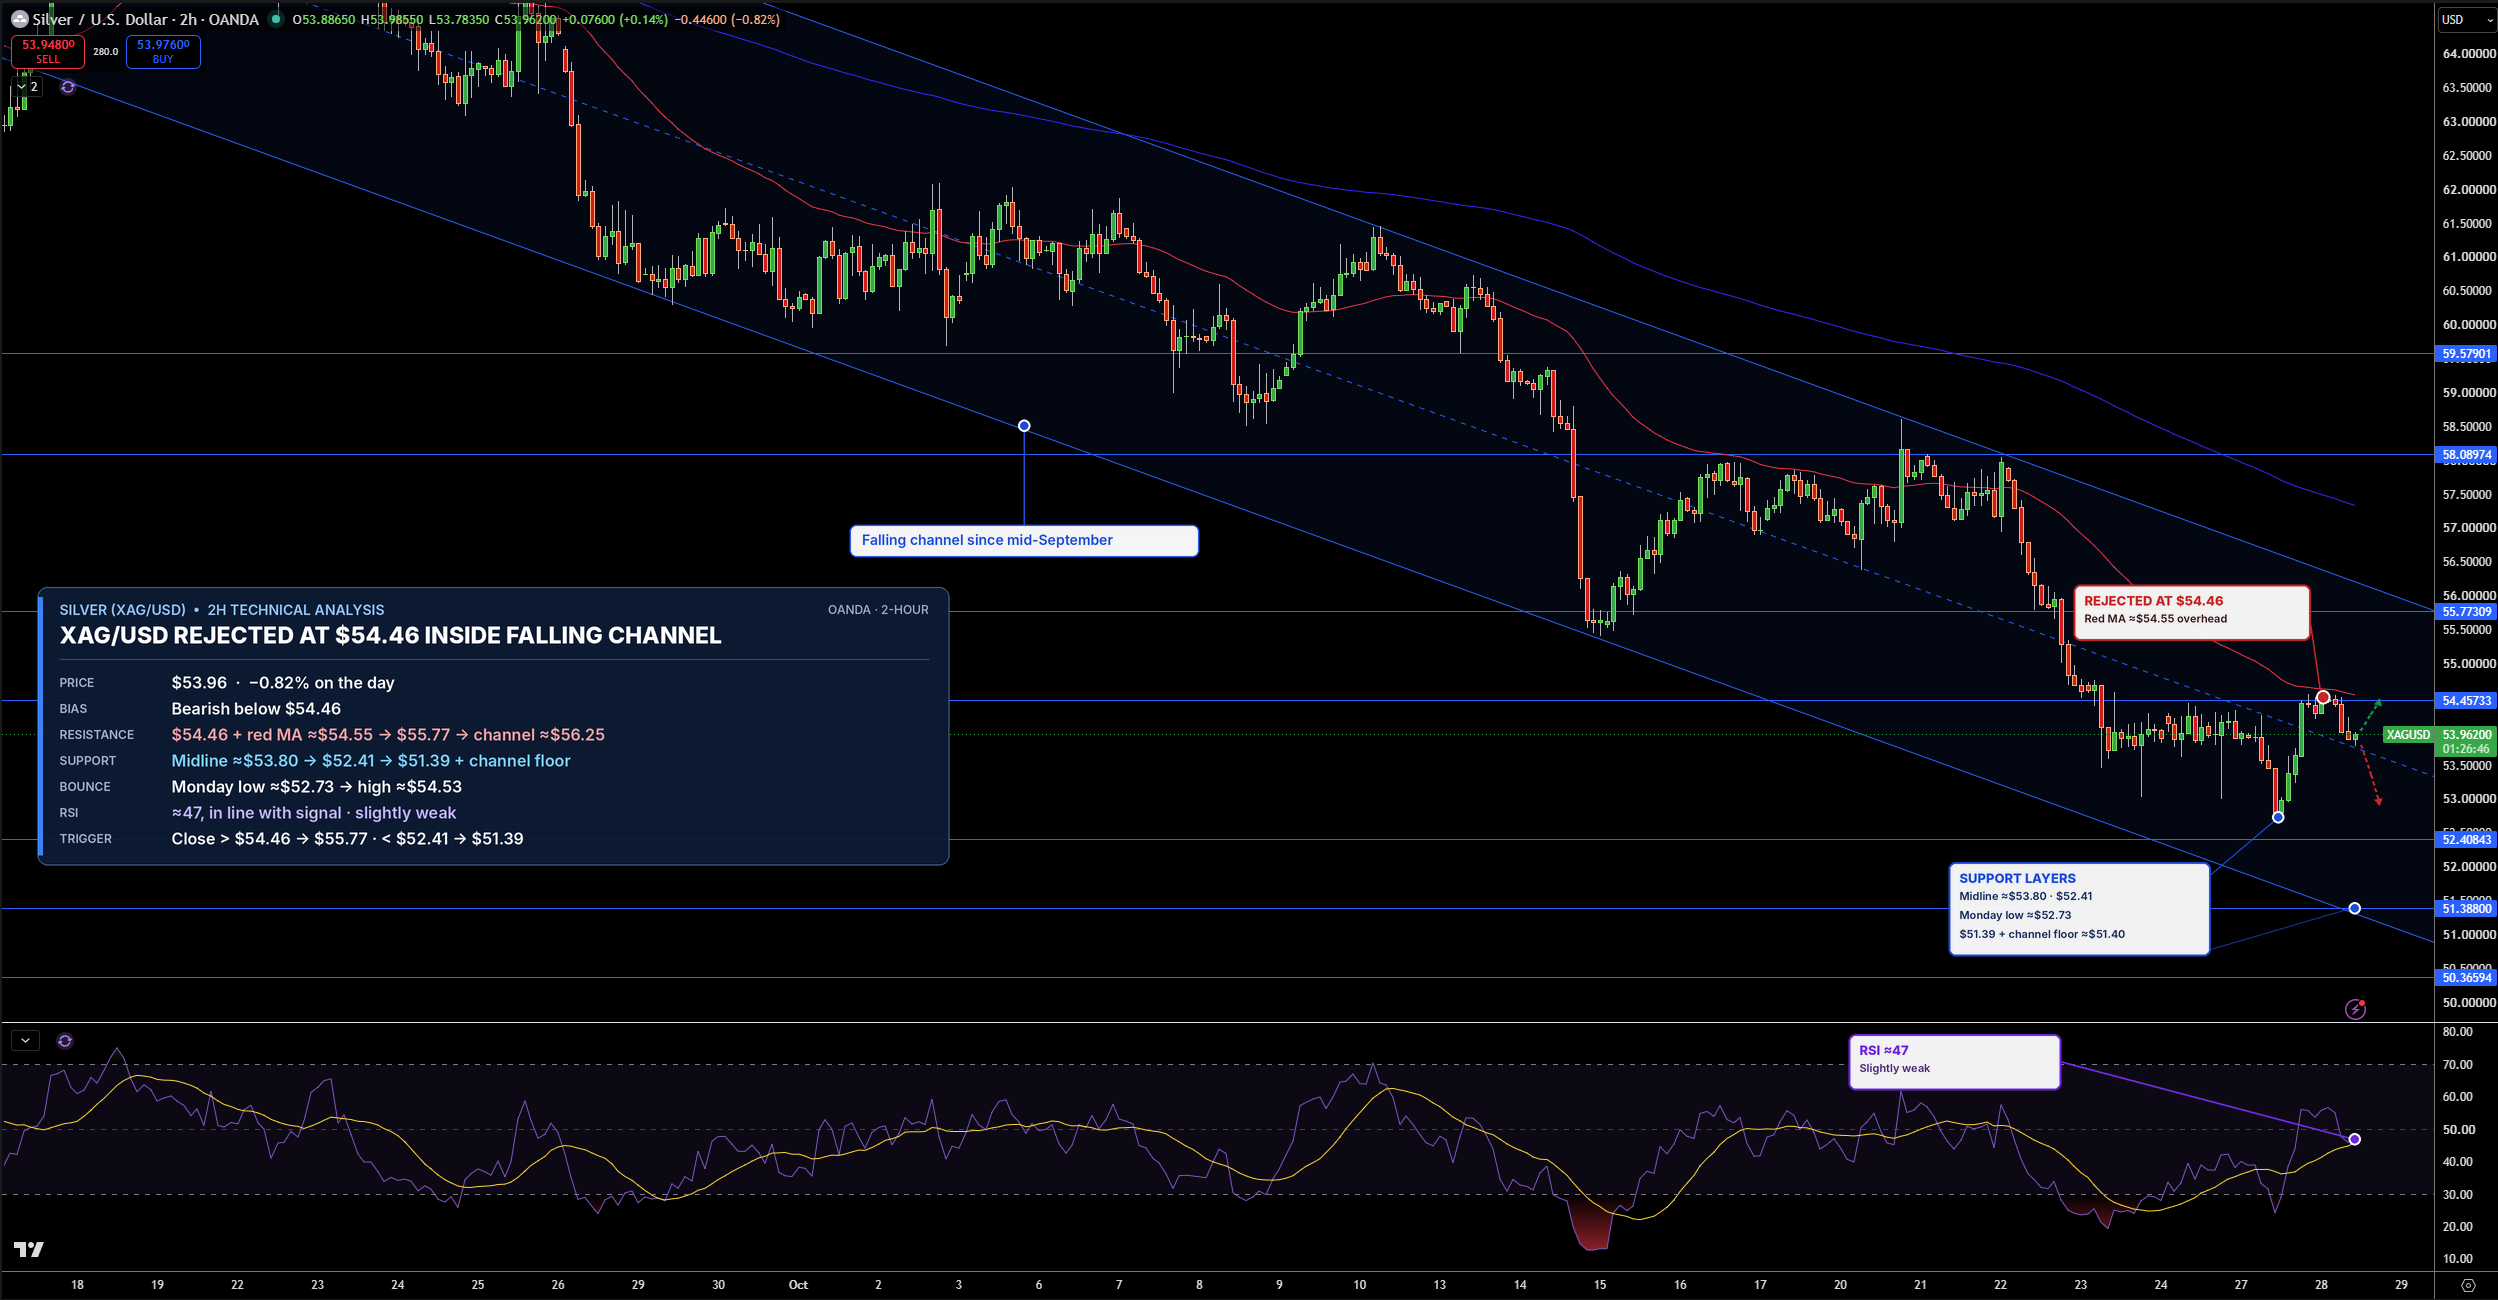
Silver is trading near $53.96 on the 2-hour chart, down about 0.8% today, still inside a falling channel, two parallel lines that have guided prices lower since September. Silver bounced from near $52.73 on Monday, but sellers stopped it at $54.46, where the faster moving average, a line showing the recent average price, also sits.
The first support is $52.41, then $51.39. On the upside, $54.46 is the first resistance, followed by $55.77.
RSI is near 47, which is slightly weak. In my view, silver stays bearish below $54.46. A close above it would open $55.77, while a drop below $52.41 would point to $51.39.