



AI Selling Hits Nasdaq
The Nasdaq Composite fell on Friday as it turned lower for the year. The selling was concentrated in artificial intelligence stocks, with Nvidia, Advanced Micro Devices and Micron each losing more than 13%.
Anthropic lost 8.5% in its second day of trading while giving back a large part of its first-day gain. Investors had hoped the company’s market debut would bring buyers back to the AI trade. Instead, the stock joined the selling on Friday.
Nvidia fell 14.01% on Friday as the selling picked up after Reuters reported that the Securities and Exchange Commission is exploring possible accounting issues at the company. The stock closed at $125.53 after reaching an intraday low at $124.50. The news gave investors another reason to sell following Jensen Huang’s departure as CEO. Even the company’s better-than-expected earnings report earlier in the week failed to stop the decline.
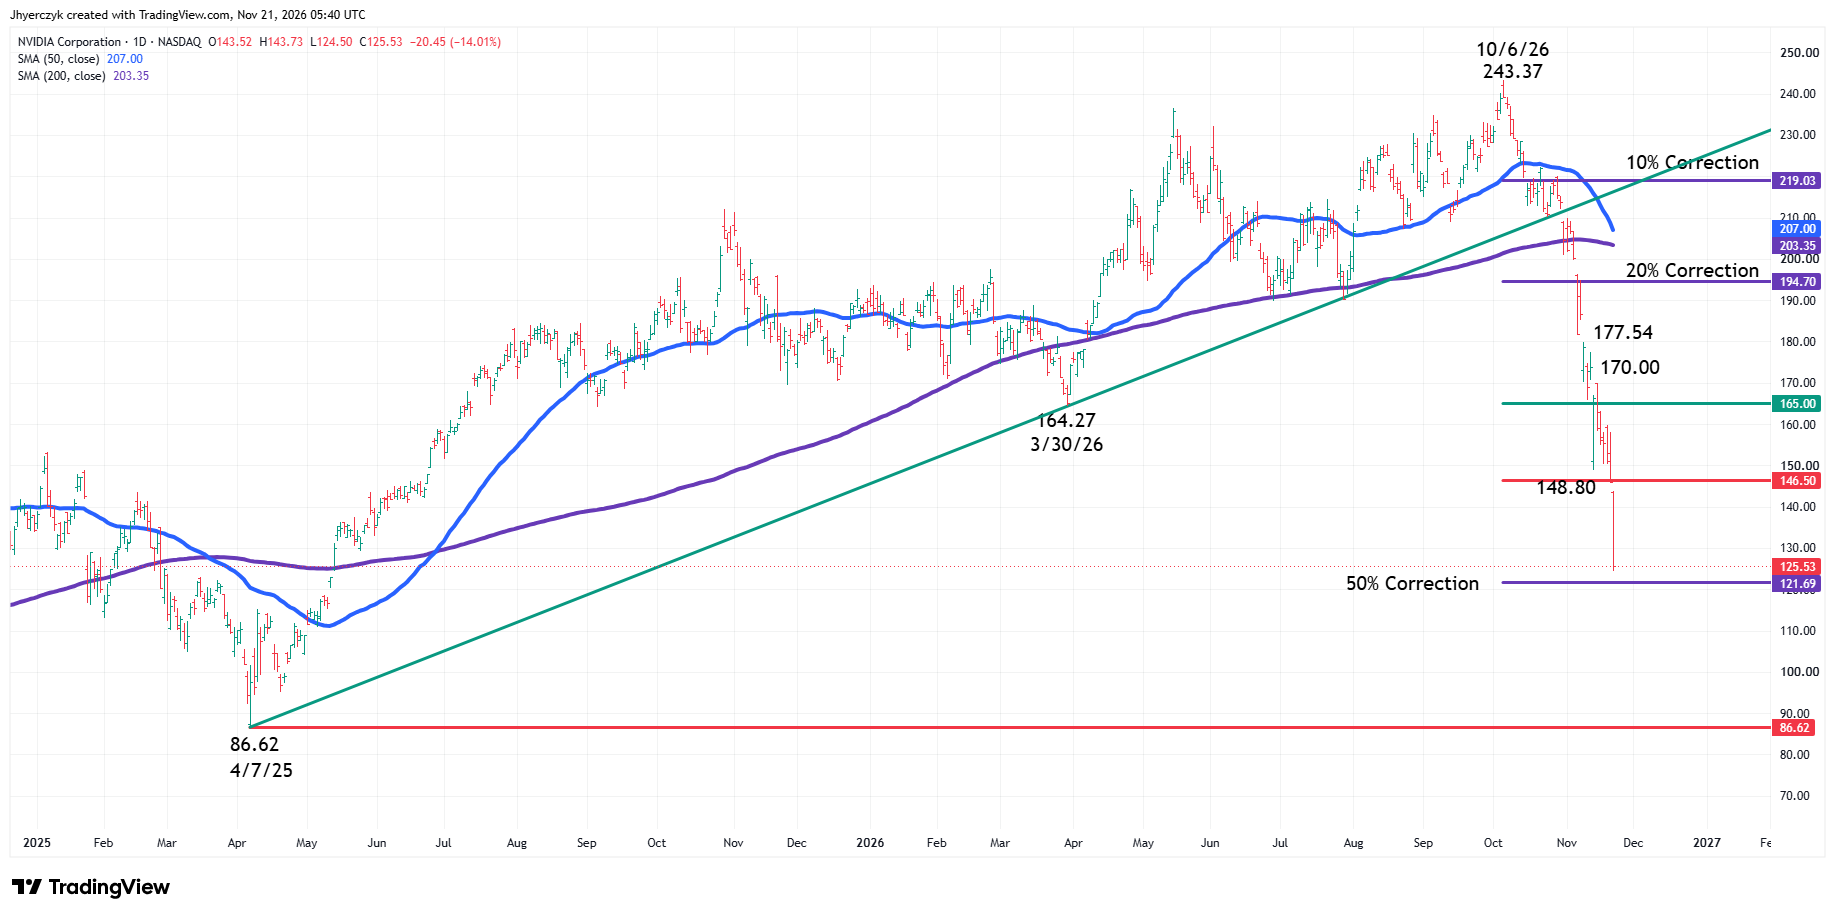
Technically, the main trend is down according to the daily swing chart. A trade through $124.50 will signal a resumption of the downtrend.
Nvidia is trading below the 50-day moving average at $207.00 and the 200-day moving average at $203.35. It has also broken the uptrending line drawn from the April 7, 2025 bottom at $86.62 through the March 30, 2026 bottom at $164.27.
The long-term range is $86.62 to $243.37. Its 50% to 61.8% retracement zone is $165.00 to $146.50. The stock is trading below this zone.
Nvidia has fallen approximately 48.4% from its October 6 high at $243.37. The 10% and 20% decline levels are $219.03 and $194.70, respectively.
Daily Nasdaq Composite Index Technical Analysis
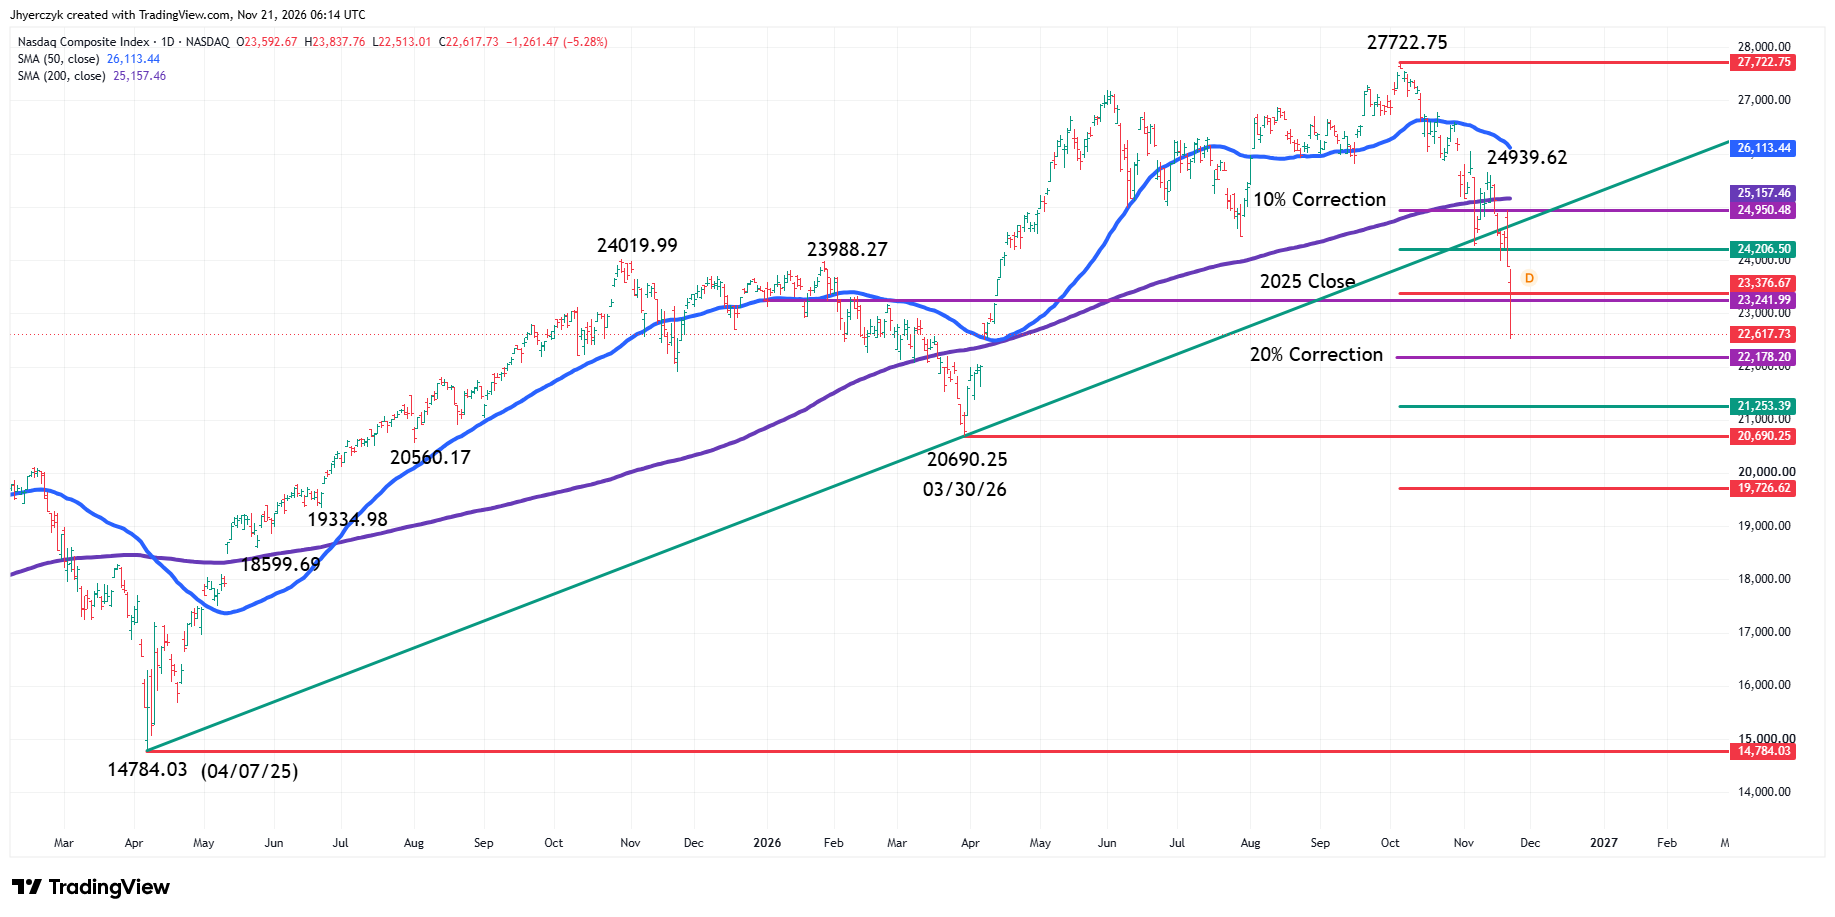
The Nasdaq Composite closed at 22617.73 on Friday, down 1261.47 or 5.28%. The index reached an intraday low at 22513.01 and finished below its 2025 close at 23241.99. It is down approximately 2.7% for the year.
The main trend is down according to the daily swing chart. A trade through 22513.01 will signal a resumption of the downtrend.
Trading Below Major Moving Averages
The index is trading below the 50-day moving average at 26113.44 and the 200-day moving average at 25157.46. It has also broken the uptrending line drawn from the April 7, 2025 bottom at 14784.03 through the March 30, 2026 bottom at 20690.25. The line came in at 24643.80 on Friday.
The Nasdaq has declined approximately 18.4% from its October 6 high at 27722.75. The 10% correction level is 24950.48. The 20% decline level, commonly used to define a bear market, is 22178.20.
Testing Key Retracement Zones
During Friday’s session, heavy selling early took out the bottom of the intermediate retracement zone at 23376.67. This is new resistance along with the 50% level at 24206.50.
The longer-term range was formed by the April 7, 2025 main bottom at 14784.03 and the October 6 main top at 27722.75. Its 50% to 61.8% retracement zone is 21253.39 to 19726.62. Inside this zone is the March 30 main bottom at 20690.25. This zone is the new downside target.
What to Watch
Nasdaq Composite
My bias is to the downside because the main trend is down and the Nasdaq is trading below the uptrending line and both moving averages.
A trade through Friday’s low at 22513.01 will strengthen my bearish outlook and put the 20% decline level at 22178.20 at risk. Continued selling through that level could extend the break into 21253.39, followed by the 20690.25 main bottom and 19726.62.
Recovering the 2025 close at 23241.99 and the 61.8% level at 23376.67 will weaken my downside bias. The next upside targets are the 50% level at 24206.50 and the uptrending line.
Nvidia
My bias is to the downside because the main trend is down and Nvidia is trading below its uptrending line, both moving averages and the long-term retracement zone.
A trade through Friday’s low at $124.50 will strengthen my bearish outlook and put the 50% decline level at $121.69 at risk. I’ll be watching the first test of that level for a possible technical bounce.
Recovering and holding above the 61.8% level at $146.50 will weaken my downside bias. The next upside target is the 50% level at $165.00.
More Information in our Economic Calendar.