



The major U.S. stock indexes opened mixed on Thursday. The blue chip Dow Jones Industrial Average is poised to extend Wednesday’s gains. The benchmark S&P 500 Index is getting some support. The tech-weighted Nasdaq is lower as investors reduced holdings in technology stocks for a second day.
The early price action suggests investors are still adjusting their portfolios to the potential shift in power in Washington with Democrats set to control Congress and the Republicans still in the White House. Among the key topics driving the price action are concerns over gridlock in Washington for the next two years as President Trump rides out his term. Worries about the Democrats’ stance on cryptocurrencies and artificial intelligence are also causing some investors to reduce holdings in technology and increase positions in more traditional sectors.
Overnight, the financial sector is performing well with gains in Goldman Sachs, JPMorgan Chase and American Express driving Dow futures higher with 1% gains.
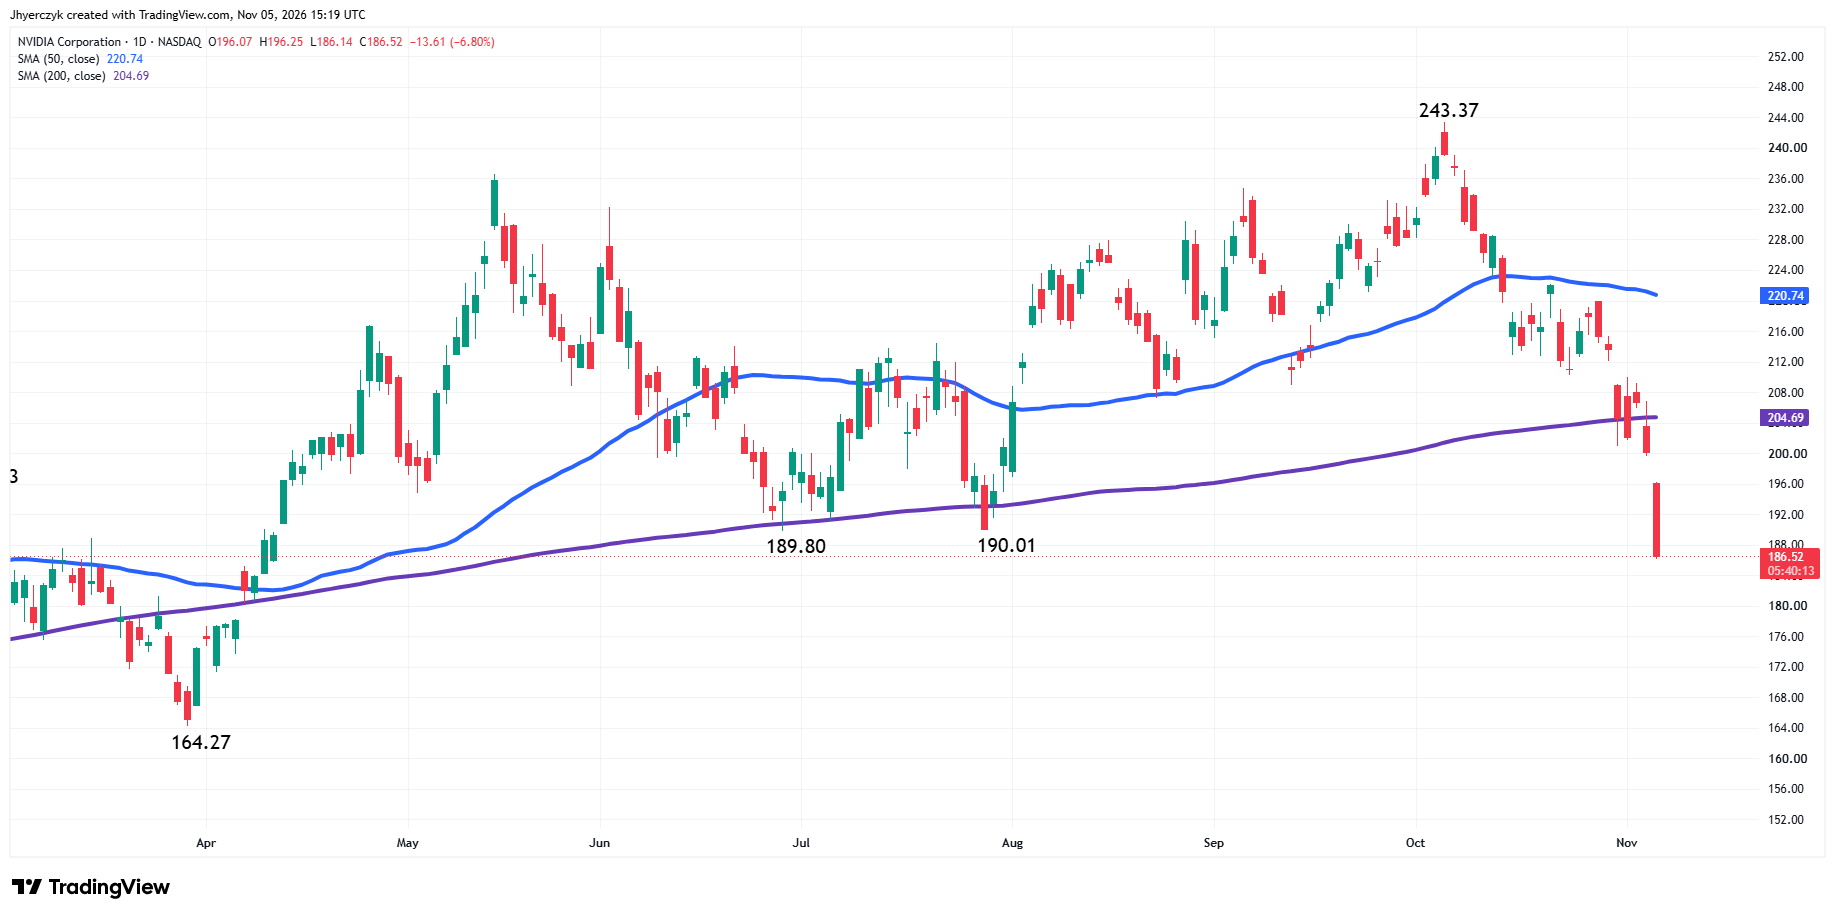
Chipmakers like Broadcom and Nvidia are expected to feel some pressure today. Software stocks can’t seem to find a place to hide either, with Oracle lower overnight. Qualcomm beat earnings estimates last night and is still lower by 9% in premarket trading. Elon Musk companies continue to face selling pressure with Tesla and SpaceX dropping 2%.
Technology shares could continue to feel heat this week as the industry is widely-expected to take some heat in light of the election results in various states and the Democratic stance on the building of data centers.
The rotation out of tech and into more traditional companies could pressure the Nasdaq today and help the Dow, but both could weaken late in the session if investors decide to trim positions ahead of Friday’s Non-Farm Payrolls report.
Daily Dow Jones Industrial Average (DJI) Technical Analysis
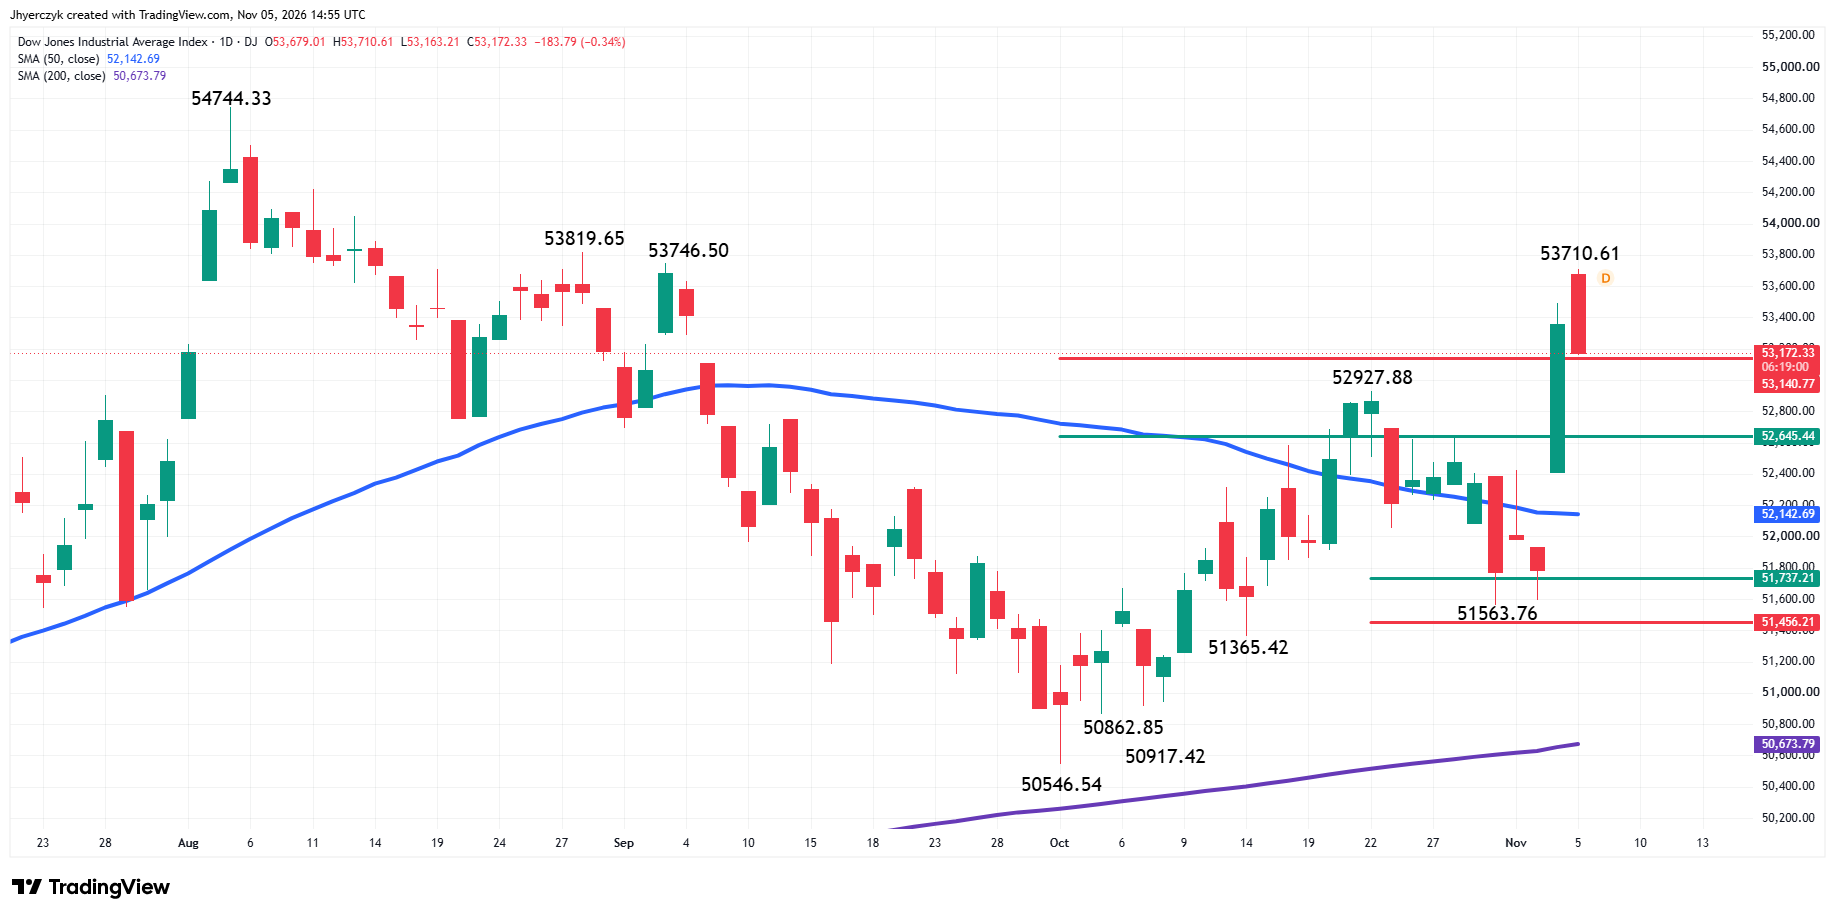
The Dow Jones Industrial Average is in an uptrend according to the main swing chart and the 50-day moving average.
The main trend was reaffirmed on the two-day swing chart on Wednesday when buyers overtook the swing top at 52927.88. The new swing bottom is 51563.76. A trade through this level will change the main trend to down.
Also on Wednesday, the Dow crossed to the strong side of a major retracement zone at 52645.44 to 53140.77 after holding a short-term retracement zone at 51737.21 to 51456.21 earlier in the week. In order to sustain the current upside momentum, buyers are going to have to continue to build on the moves.
Wednesday’s strong rally was also helped by a gap over the 50-day moving average at 52148.52. This is a potentially bullish move that could have long-term ramifications if buyers can sustain the rally over it.
Dow Jones Price Forecast
Every new Dow Jones analysis as it publishes, today's technical signal and key levels, live price — on one page.
See all Dow Jones forecastsDaily Nasdaq Composite Index (IXIC) Technical Analysis
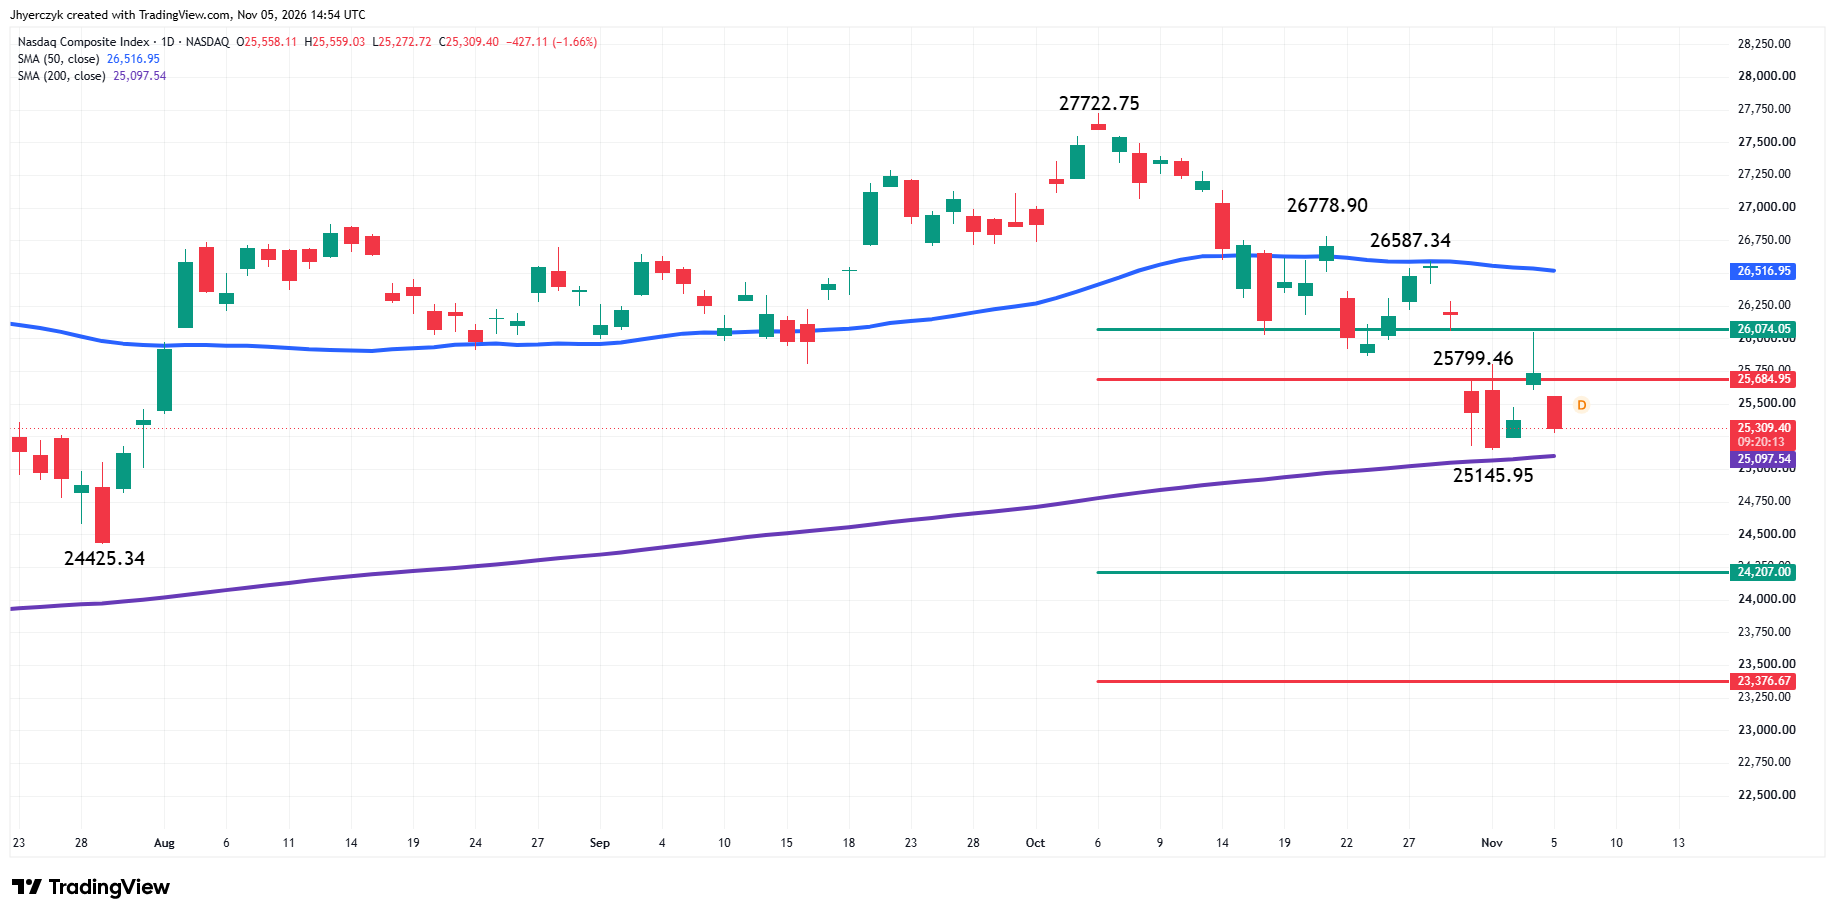
The Nasdaq Composite Index is sharply lower shortly after the opening on Thursday. The main trend is down according to the daily swing chart. A trade through 26587.34 will change the main trend to up. Taking out the swing bottom at 25145.95 will signal a resumption of the downtrend.
The minor trend is up. It turned up on Wednesday when buyers took out 25799.46. It’s vulnerable to a change in trend to down under 25145.95.
On the upside, retracement zone resistance is 25684.95 to 26074.05. It stopped the rally yesterday at 26048.83.
On the downside, the long-term support zone is 24207.00 to 23376.67.
The 50-day moving average at 26516.95 is a major resistance level and potential trigger point for an upside breakout. The 200-day moving average at 25097.54 is potential support and trigger point for an acceleration to the downside.
What to Watch
Dow Jones Industrial Average (DJI)
My bias is to the upside on Thursday, but fresh money is going to have to come in to drive the Dow higher. A move like that may be necessary to create the momentum needed to challenge the next two main tops at 53746.50 and 53819.65. These are the last two barriers before the all-time high at 54744.33.
A break back under the 61.8% level at 53140.77 will weaken my outlook because it could lead to the start of a normal retracement back to the 50% level at 52645.44 and the 50-day moving average at 52148.52.
Essentially, what it is going to come down to over the short-run is investor willingness to chase the market higher like Wednesday’s trade, or wait for pullbacks into value areas then passively bid for stocks.
Nasdaq Composite Index (IXIC)
My bias is to the downside because of the lower top and lower bottom chart pattern, the reaction to the retracement zone at 25684.95 to 26074.05 and the trade on the weak side of the 50-day moving average at 26516.95.
Overcoming the 50% level at 26074.05 will begin to weaken my bearish outlook. Crossing to the strong side of the 50-day moving average will change my outlook to bullish.
A trade through the 200-day moving average at 25097.54 will strengthen my bearish outlook with 24207.00 to 23376.67 as my major downside target.
More Information in our Economic Calendar.