



Oil Pares Gains as Vance Letter Revives Hopes for Iran Talks
Crude retreated on Thursday as a renewed US push for talks with Tehran offset worries about escalating attacks in the Gulf. Even so, US inventory data again pointed to a tightening domestic market, which is why the pullback has been shallow.
Brent: Diplomacy Back on the Table
December Brent, which expires on Friday, fell 1.1% to $114.10 and WTI 1.3% to $101.45 early Thursday, giving back part of Wednesday’s gains. US Vice President JD Vance sent a letter to Iranian Security Council chief Mohsen Rezaei to revive peace negotiations, the Wall Street Journal reported, citing US officials. Nomura’s Yuki Takashima said selling pressure reflected expectations that talks may resume, though the decline remained limited.
The limit is easy to explain. A senior Iranian official dismissed a new draft deal from Qatari mediators as unacceptable, Reuters reported, and Houthi attacks continued, including the claimed strike on Ras Tanura, Saudi Arabia’s largest refinery. Talks are being offered, but nobody has accepted them yet.
WTI: Surprise Crude Draw
US crude inventories fell 1.9mn barrels to 410.6mn in the week to October 23, against expectations for a small build, the EIA said. Stocks now sit about 4% below the five-year average, the normal level for this time of year. Gulf Coast inventories fell to their lowest since December 2024, Cushing stocks, the delivery point for WTI futures, dropped 624,000 barrels, and exports jumped 1.4mn bpd to 4.85mn bpd. Distillates, which include diesel and heating oil, fell 1.5mn barrels to about 10% below the five-year average. Gasoline was the exception, rising 3.9mn barrels as implied demand slipped.
Natural Gas: Contract Rolls, Curve Stays Weak
The November futures contract expired about 3% higher at $2.776 on Wednesday on stronger near-term demand forecasts and rising LNG flows, Reuters reported. Still, the 12-month strip, the average price of the next twelve monthly contracts, fell to a 26-month low of $2.84, a sign the market sees ample supply well past this winter. Meteorologists expect milder-than-normal weather through November 12.
Natural Gas Price Forecast
Every new Natural Gas analysis as it publishes, today's technical signal and key levels, live price — on one page.
See all Natural Gas forecastsWTI Technical Analysis: Oil Slips Below $102 as $103.94 Caps the Rally
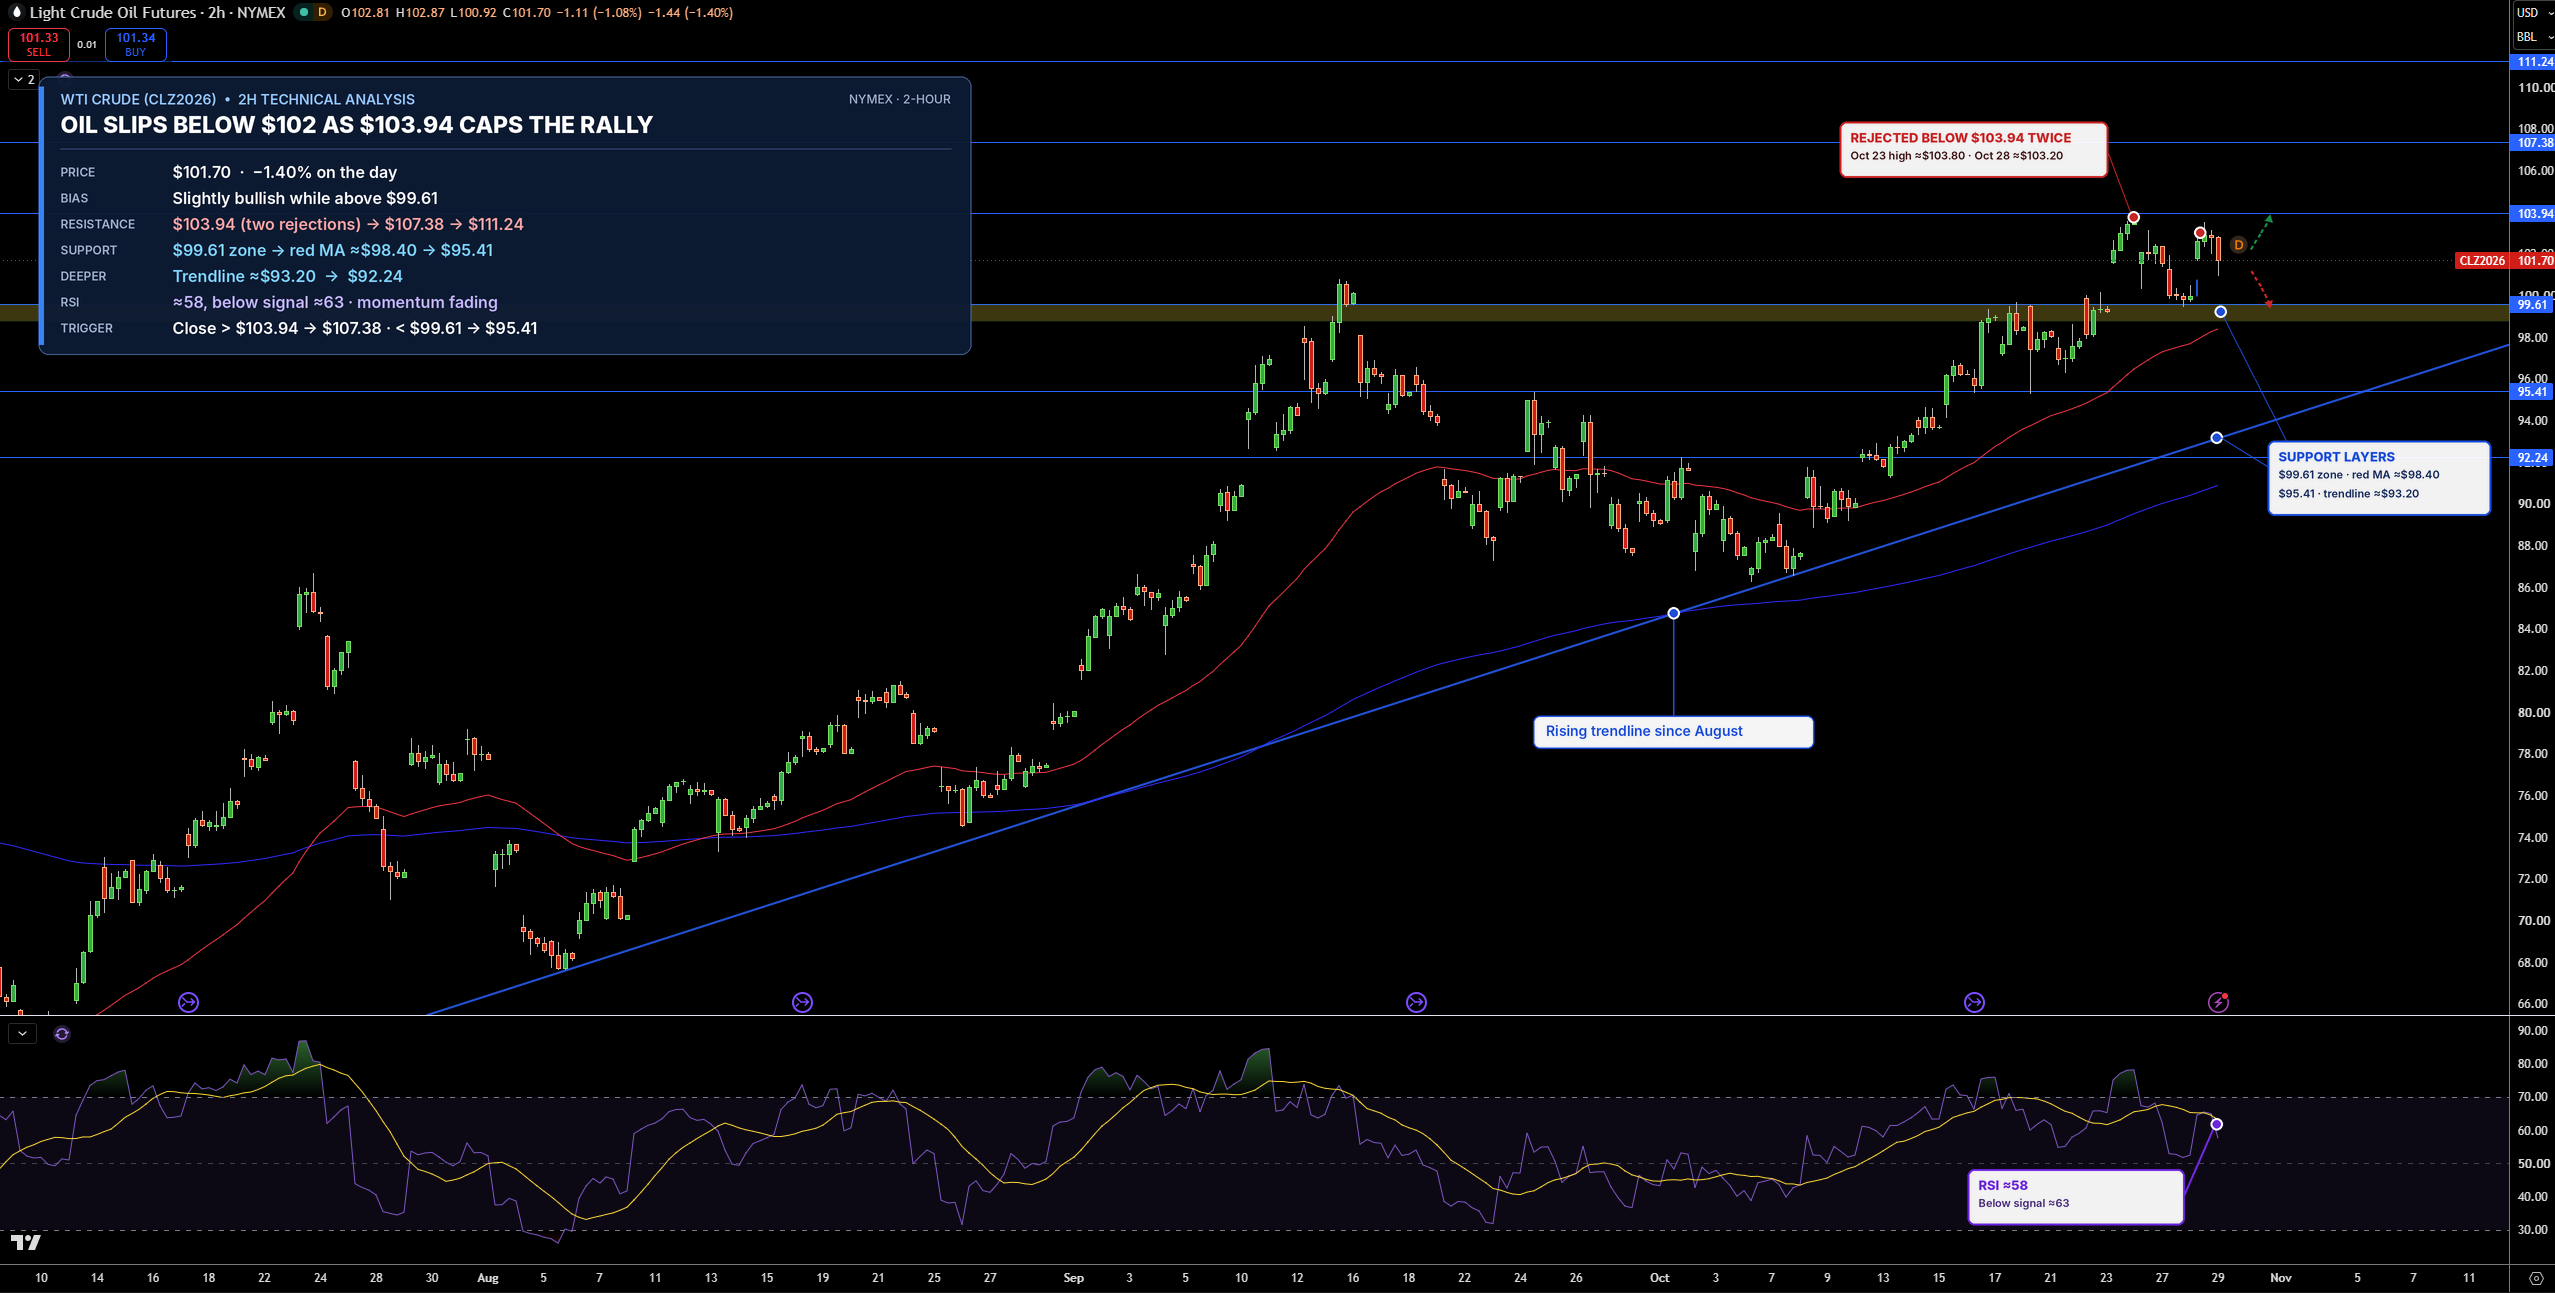
WTI is trading near $101.70 on the 2-hour chart, down about 1.4% today. Oil was rejected just below $103.94 for the second time in a week, so that ceiling is getting stronger. Prices remain above the $99.61 zone, an old ceiling that now acts as a floor.
Support, where buyers tend to step in, is $99.61, then $95.41. Resistance, where sellers tend to step in, is $103.94, then $107.38.
RSI, which measures the strength of recent buying and selling, is near 58 and below its signal line, a slower average of RSI, so momentum is fading. I keep a slight bullish lean while WTI holds $99.61. A close above $103.94 would open $107.38, while a drop below $99.61 would point to $95.41.
Brent Technical Analysis: Oil Rejected Again at $112.20 as $109.17 Holds
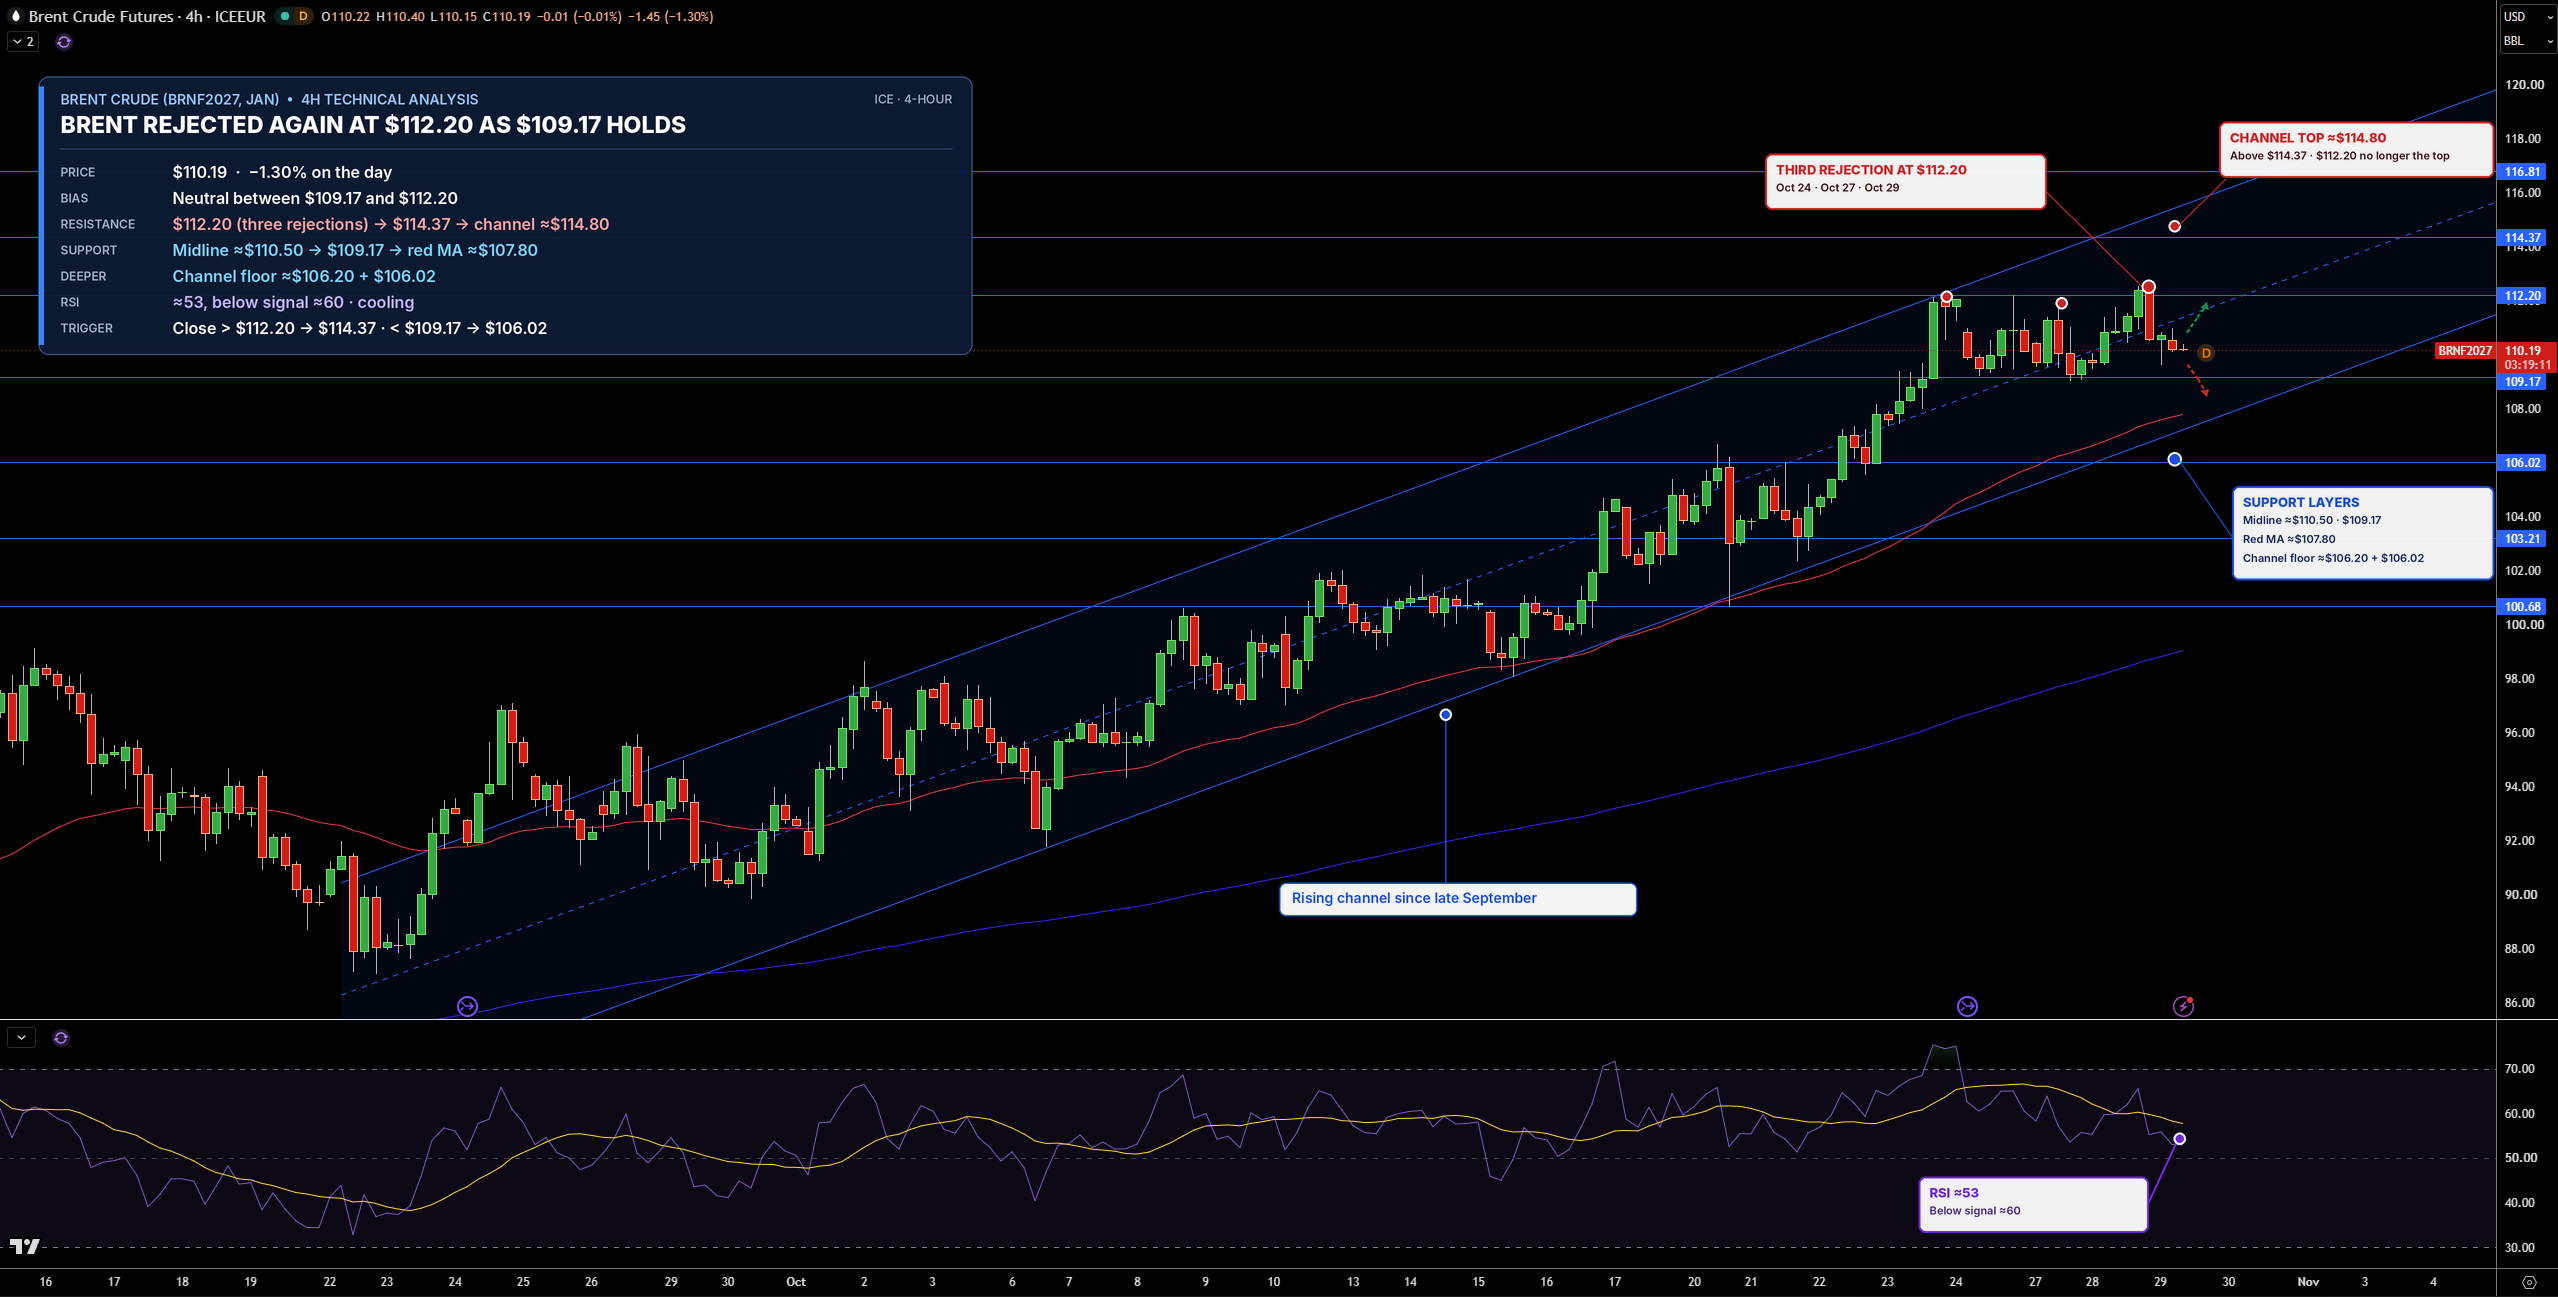
January Brent futures are trading near $110.19 on the 4-hour chart, down about 1.3% today. Brent tested $112.20 for the third time and was pushed back again, though it remains inside its rising channel, two parallel lines that have guided prices higher since late September. It has moved sideways between $109.17 and $112.20 for nearly a week.
The first support is $109.17, then $106.02. On the upside, $112.20 is the first resistance, followed by $114.37.
RSI is near 53 and below its signal line, so momentum is cooling. My bias is neutral while Brent trades between $109.17 and $112.20. A close above $112.20 would open $114.37, while a drop below $109.17 would point to $106.02.
Natural Gas Technical Analysis: NG Holds $3.00 as $3.12 Caps the Rebound
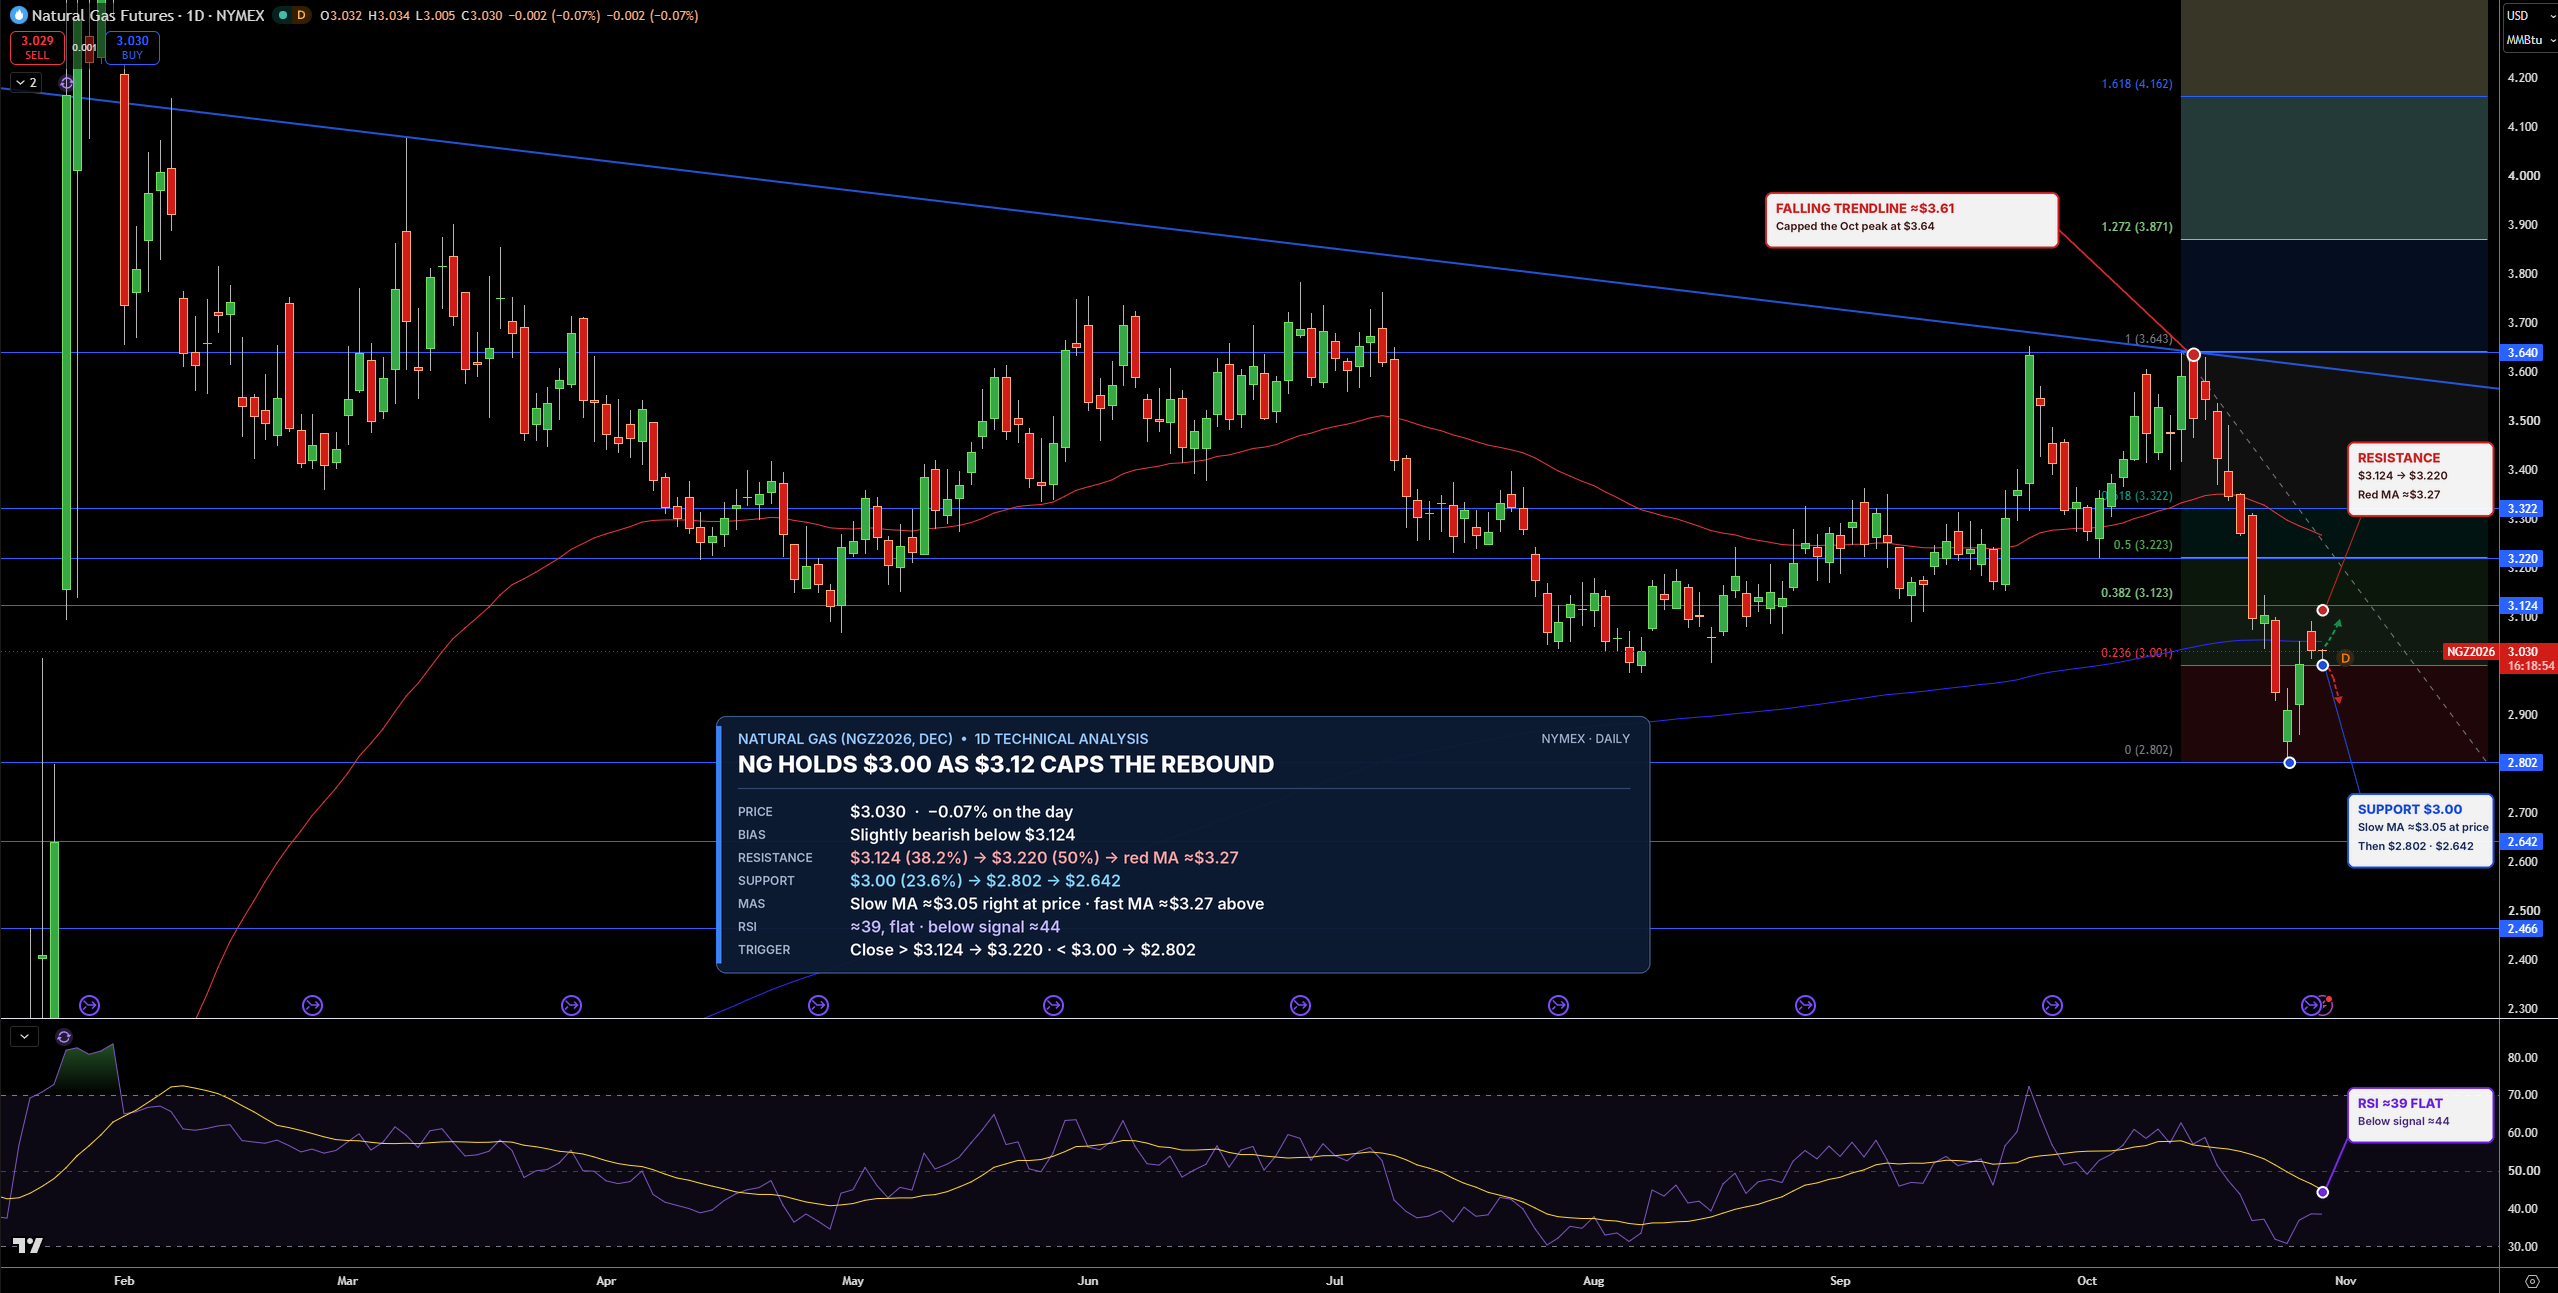
December natural gas is trading near $3.03/MMBtu on the daily chart, little changed today. After bouncing from near $2.80 on Monday, prices have stalled just above $3.00. The slower moving average, a line showing the longer-term average price, sits right at current levels.
The first resistance is $3.12, then $3.22. Both are Fibonacci levels, which measure how much of the drop has been recovered. Support sits at $3.00, then $2.80.
RSI is flat near 39, so the rebound has lost pace. In my view, gas keeps a slight bearish lean below $3.12. A close above it would open $3.22, while a drop below $3.00 would point to $2.80.