


Lower High Reinforces Near-Term Selling Pressure
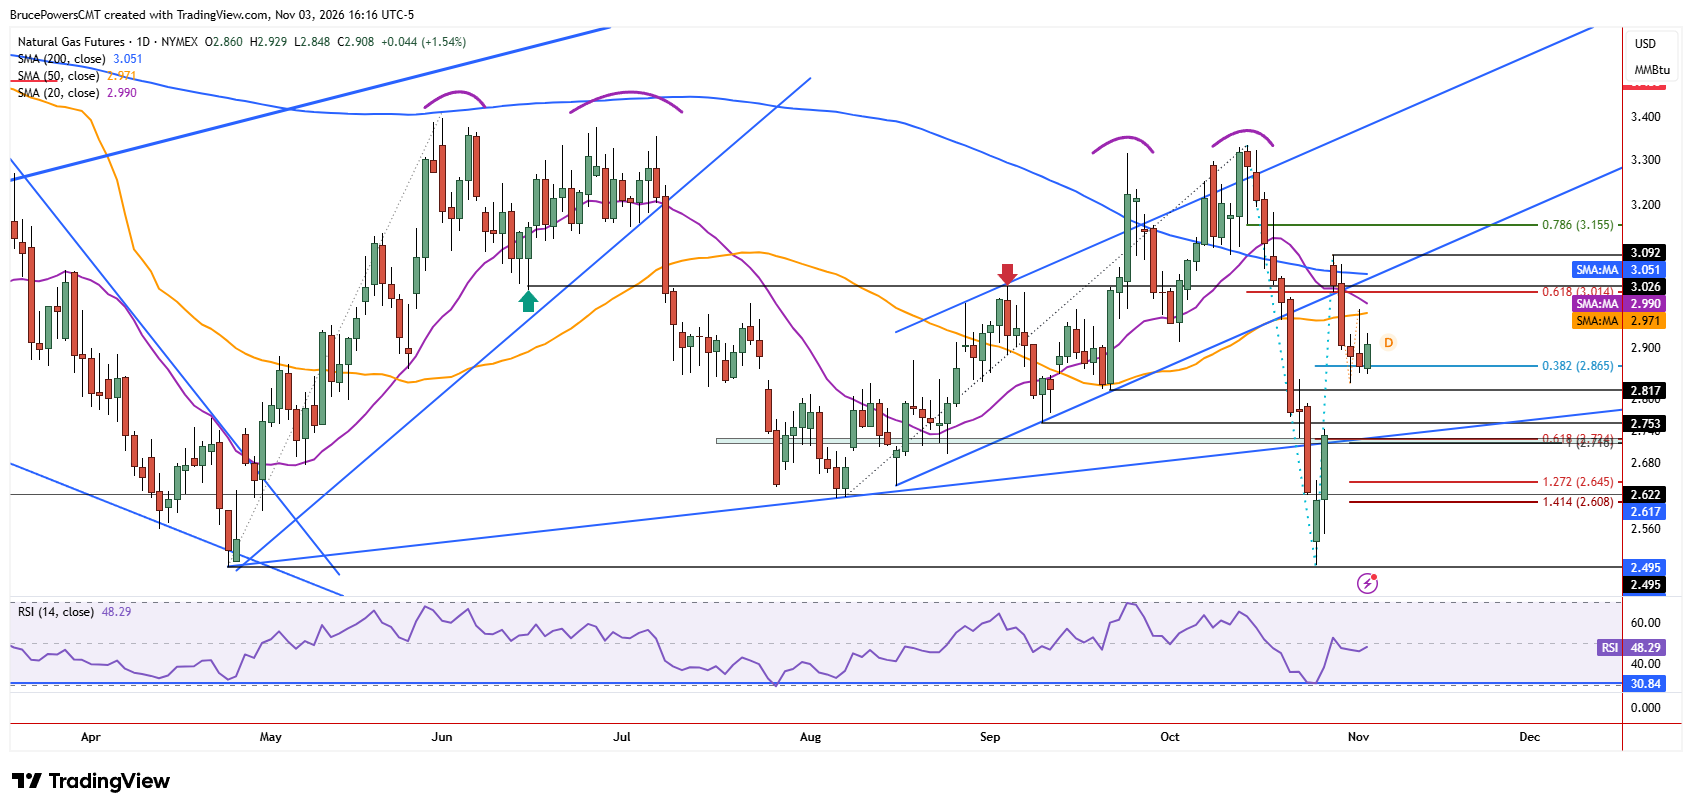
Natural gas established a lower daily high of $2.93 on Tuesday, further testing resistance at the 50-day moving average near $2.97, which was touched on Monday. The weak close on Monday was near the session low of $2.85, reflecting continued selling pressure, while Tuesday’s session again tested that support area, reinforcing its importance as a near-term pivot. If $2.85 is broken to the downside, the recent lower highs would reinforce the bearish short-term structure and suggest that the decline may continue.
Bearish Confirmation Could Expose Deeper Support
A decline below last week’s low of $2.83, however, would be needed to signal a bearish continuation. The falling 20-day moving average is heading toward a bearish crossover below the 50-day moving average, which would add to the downward technical pressure. An initial, more significant support zone is indicated by a small rising trendline connecting with the August swing low.
The prior swing low of $2.75, along with the Fibonacci confluence zone near $2.72, can be used as a proxy for the lower boundary. However, a close below both the trendline and this price zone would indicate that sellers have retained control, increasing the likelihood of another test of support near the recent low of $2.50 and April’s low of $2.495.
Failed 200-Day Moving Average Reclaims
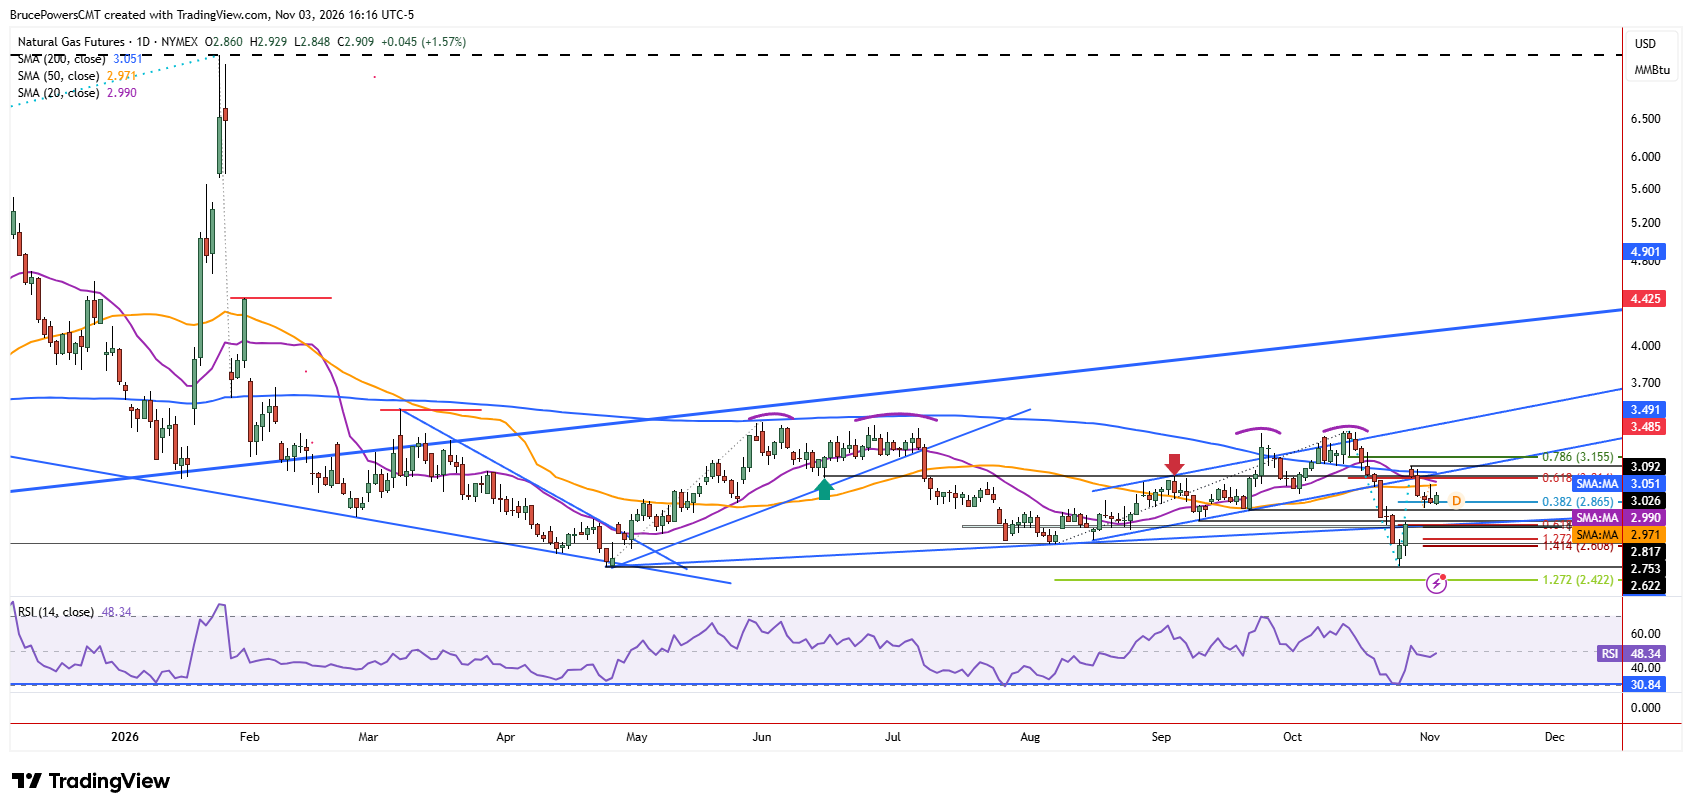
The failure to advance above the 200-day moving average occurred with last Wednesday’s high of $3.09. That followed two recent attempts to reclaim that long-term average, both of which failed and were followed by a sharp decline to the October low of $2.50.
Buyers Still Have an Opportunity to Stabilize Prices
Despite the potential for the short-term downtrend to extend, support has essentially held for the past few days around the 38.2% Fibonacci retracement of the prior decline at $2.865. That could result in further consolidation and another test of resistance near the 50-day moving average. If price eventually breaks above Monday’s high of $2.98, the upper resistance zone is defined by the 200-day moving average, now near $3.05. Until then, the repeated tests of support near $2.85 remain important, with a breakdown below $2.83 providing stronger confirmation of continued selling pressure.
Natural Gas Price Forecast
Every new Natural Gas analysis as it publishes, today's technical signal and key levels, live price — on one page.
See all Natural Gas forecastsIf you’d like to know more about how to trade natural gas, please visit our educational area.