


Bullish Reversal Emerges at Key Support
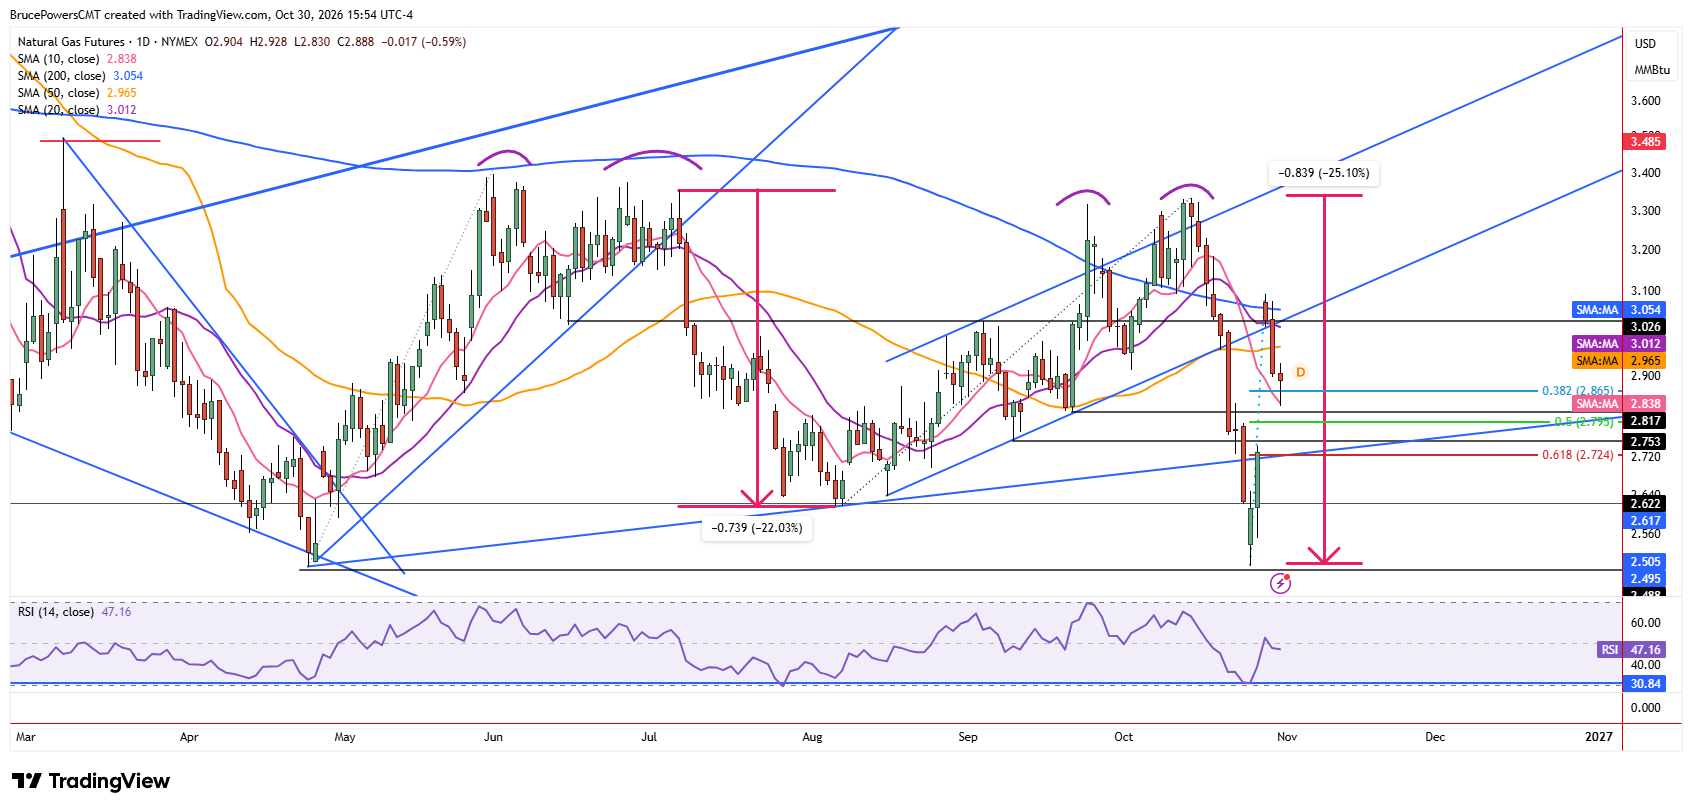
Natural gas continued this week’s decline to a low of $2.83 on Friday, where it found support and bounced. Support was found near the 10-day moving average and resulted in buyers taking back control and driving price higher, with a strong close on track in the top third of the day’s range. The recovery formed a bullish hammer candlestick pattern, reflecting an initial reaction of lower prices at key support and an increasingly aggressive response from buyers. A lower daily high of $2.93 was established, providing short-term resistance and a bullish one-day reversal signal if it is triggered.
Overhead Resistance Defines Bounce Potential
If the intraday bounce continues with a rally above Friday’s high, two key potential resistance zones stand out. The first is near the 50-day moving average at $2.97 and the second is near Wednesday’s low of $3.01. That level is reinforced as resistance by the 20-day moving average near $3.01 and the 200-day moving average near $3.05, plus a rising trendline at the lower boundary of a bullish trend channel. This upper resistance zone is expected to hold and represents the current upside target for a bounce.
Larger Consolidation Pattern Offers Perspective
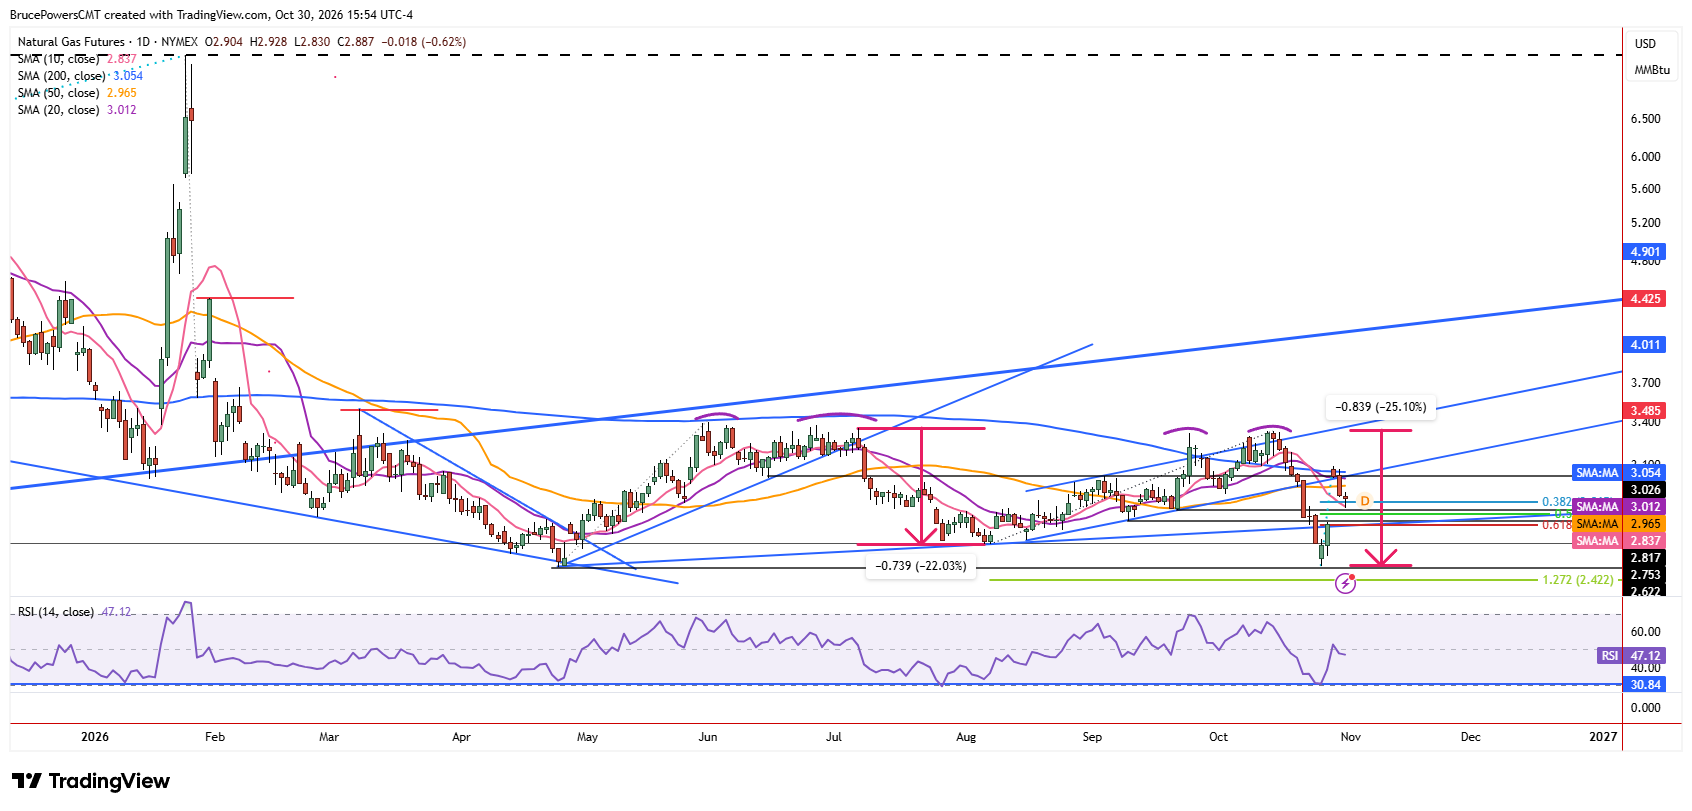
Nonetheless, on October 21 natural gas broke down from the rising channel and the 50-day moving average on the same day, resulting in a sharp decline to $2.50. At the same time, natural gas is trading inside a large rectangle consolidation pattern that began with the April low of $2.495. Last week’s low may have established another swing low within this broader range. This could lead to a lower volatility environment as the current pullback develops and provides additional information about the balance between buyers and sellers.
$2.83 Becomes Critical Downside Trigger
For now, a rally above Friday’s high may lead to a test of resistance near the 200-day moving average, which is likely to attract increased selling pressure. That may then lead to another leg down from Wednesday’s high of $3.09. A decline below Friday’s low of $2.83 would signal a bearish continuation, while confirming a break of nearby support at the 10-day moving average, now near $2.84
If you’d like to know more about how to trade natural gas, please visit our educational area.