



Copper (XCU) prices remain close to record highs as the improvement in factory activity in China supports the demand outlook. But the weakness in construction and real estate, a stronger U.S. dollar and growing expectations of another Fed rate hike could limit gains in the short term. This article examines the latest macro developments, copper price charts and the silver (XAG) to copper ratio to determine the next move in the copper market.
China PMI Improvement Supports Copper Demand Outlook
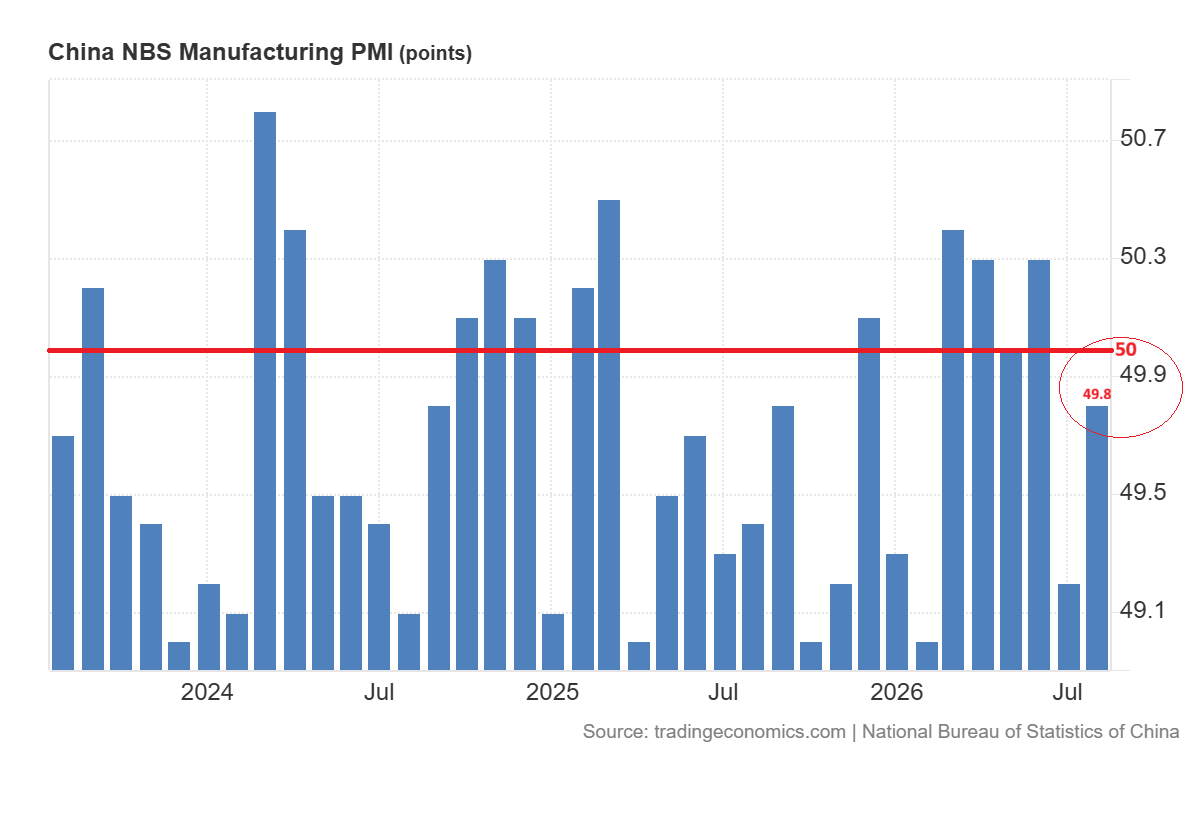
The manufacturing sector of China improved in August. The official manufacturing PMI increased to 49.8 from 49.2 in July. This also beat the market estimates of 49.6. But the index was still under 50 for the second month in a row. This suggests that the contraction is starting to soften but the full recovery has not yet started.
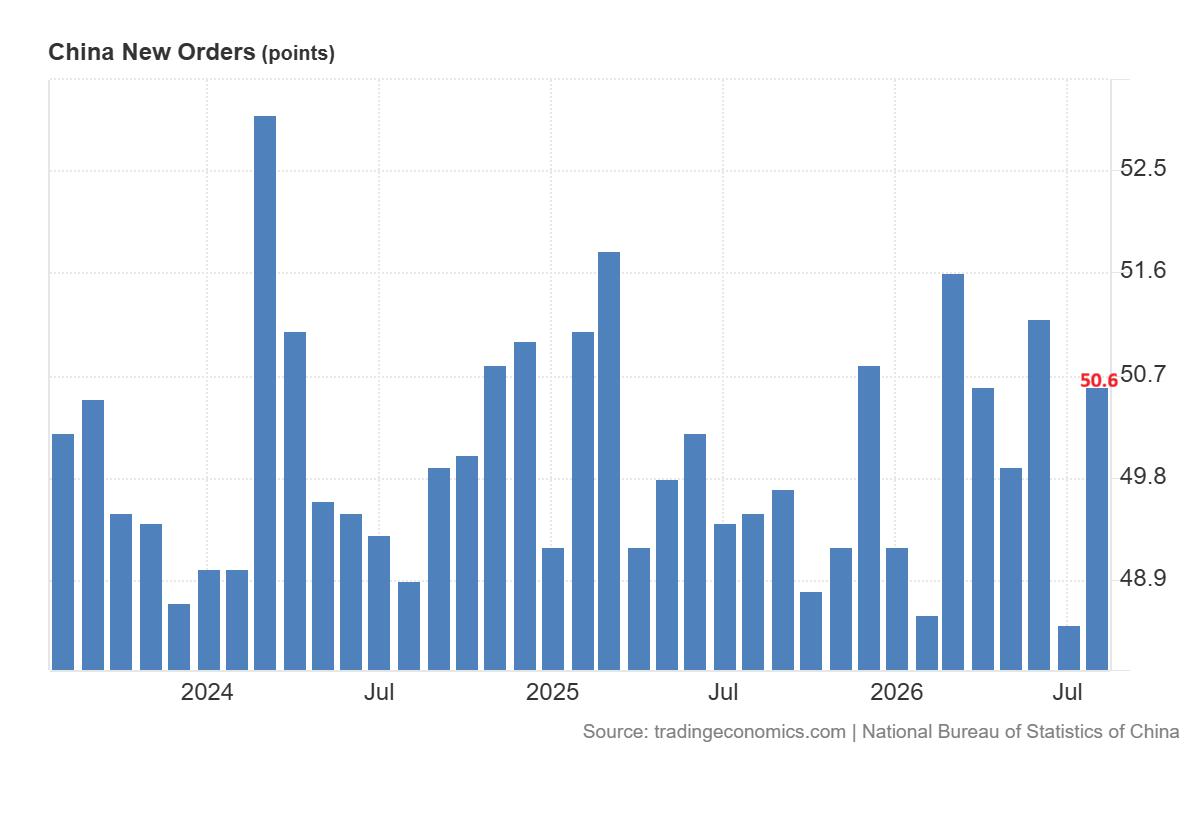
The raw data offered some support for copper demand. The new orders index also rose from 48.5 to 50.6 and the production index was up from 49.9 to 50.4.
The firms also continued to report growth in high-tech and equipment manufacturing. The large-scale consumption of copper takes place in these industries for manufacturing of machinery, power facilities and electronic equipment.
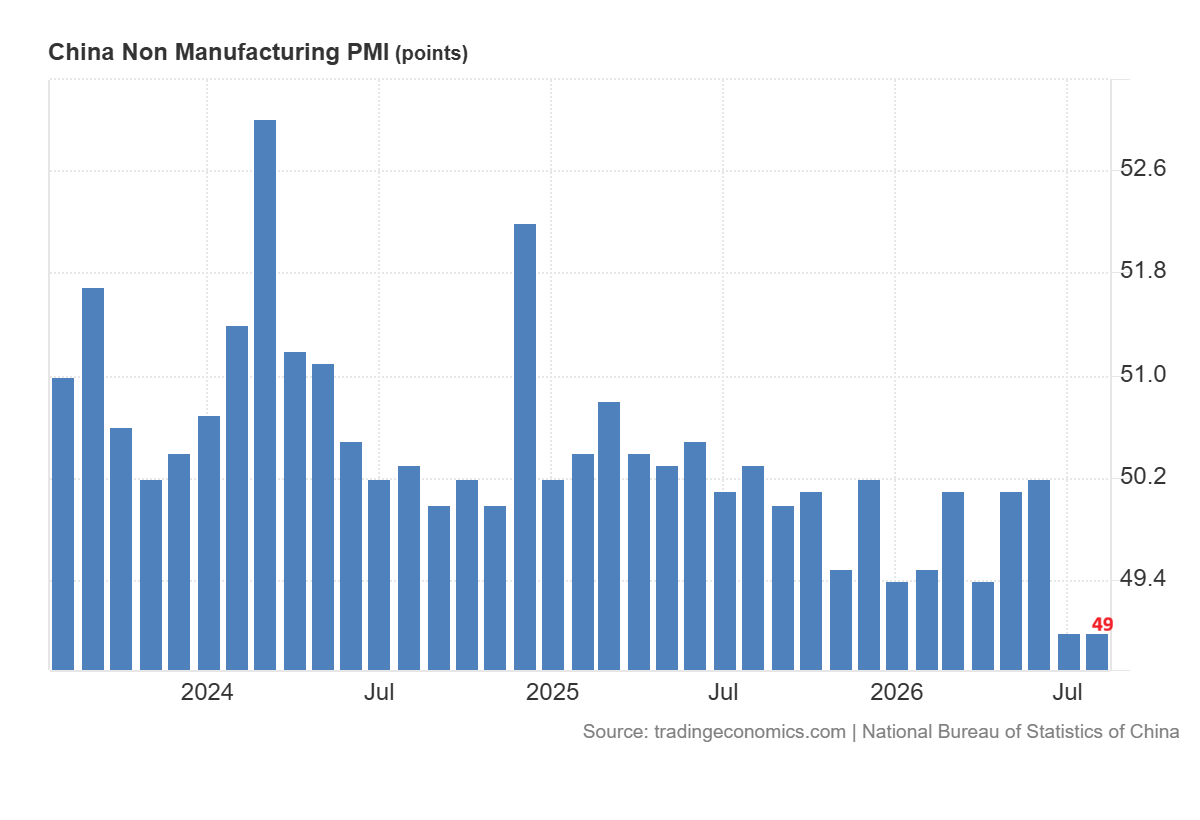
Their expansion could support copper prices near the record high despite the uncertainty in the US dollar market on a hawkish Fed. But the Chinese economy is still weak. The non-manufacturing PMI remained unchanged at 49.0 and the construction index fell slightly to 46.9 from 47.0. The weakness in real estate could limit the demand for construction and housing in China. The latest data continues to favor copper prices. But it is not the key catalyst for sustained breakout.
Copper Price Forecast
Every new Copper analysis as it publishes, today's technical signal and key levels, live price — on one page.
See all Copper forecastsCopper Prices Face Stronger Dollar and Fed Rate Hike Risk
The U.S. dollar index was down near 99.5 on Monday after gaining 0.55% in the previous session. It held steady near its highest since Aug. 17. The dollar rallied on the back of rising investor expectations for one more Fed rate hike. A higher dollar will increase the cost of the metal to those trading in other currencies and could help to limit fresh buying.
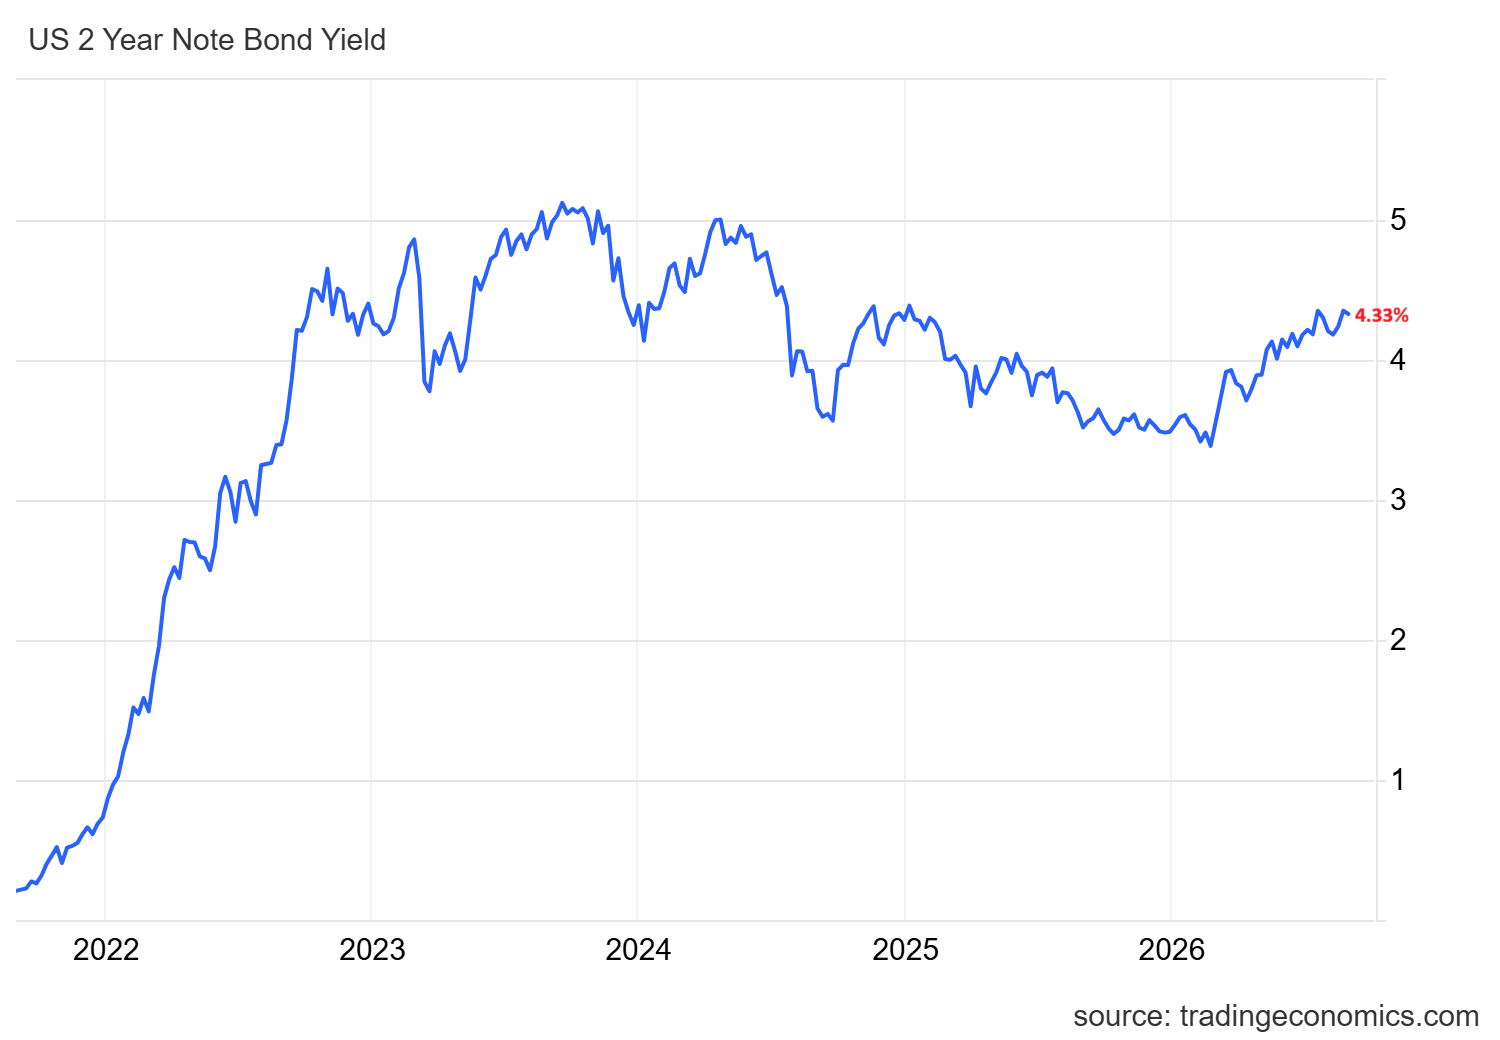
The market is now pricing a September rate hike to be close to 60%. The two-year Treasury yield was similarly around 4.33%, up from its levels seen for over a month. A rate hike in September will likely increase the probability of further rate hikes in December. Increased short-term yields could help to tighten the dollar and reduce speculative demand for copper and commodities.
The increase in oil prices creates another risk. New tensions in the Gulf drove oil prices higher and added to the safe haven appetite for the dollar. The rising prices for energy also increase inflation pressures in the United States and strengthen the case for additional Fed rate hikes. This creates a temporary negative force for copper. But if U.S. employment or inflation data are weaker, they may pull the US dollar down and allow more room to rally.
Copper Price Technical Analysis Targets $7.50
Break Above $6.90 Could Trigger the Next Rally
The daily chart for copper prices shows constructive bullish price action in the short term. The chart shows the formation of an inverted head and shoulders pattern from January 2026 to May 2026. The breakout from the neckline of this inverted head and shoulders pattern at $6.20 has triggered positive momentum.
The price has been consolidating between $6.00 and $6.70 for the past four months and is now looking to break higher. The recent consolidation in August between $6.50 and $6.90 has produced price compression. Therefore, a break above $6.90 will likely trigger a strong move toward $7.50.
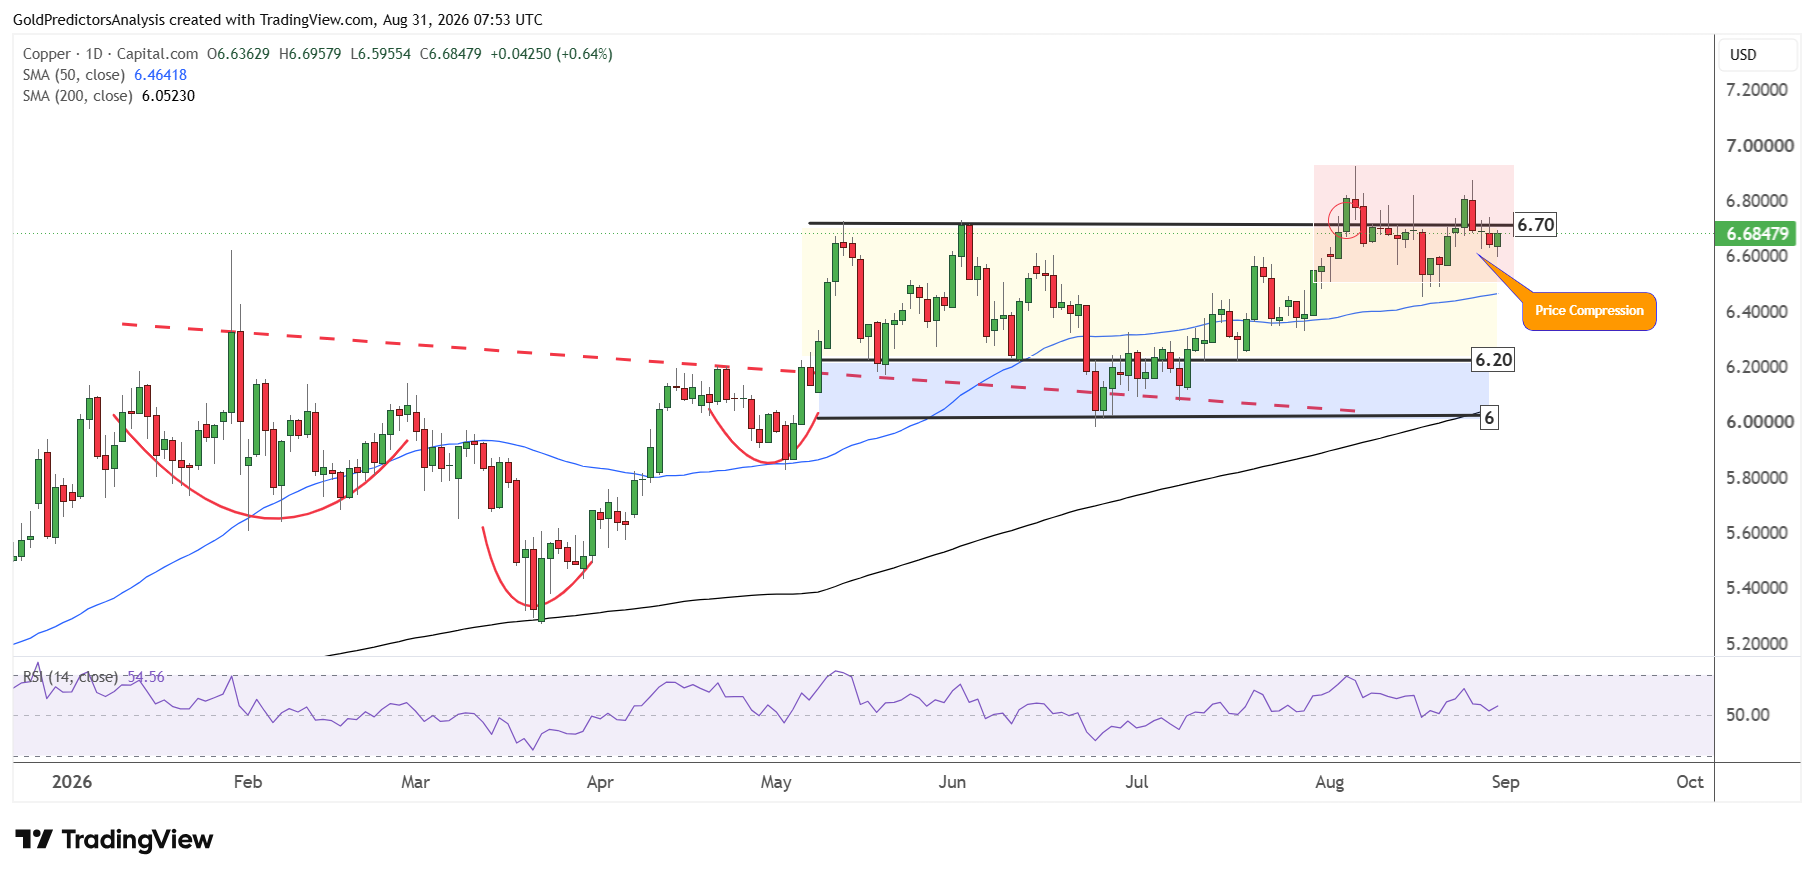
The 50-day SMA remains above the 200-day SMA and the RSI also remains above the midline. These conditions indicate that copper prices will likely break above $6.90 and open the way for a strong move toward $7.50.
Higher interest rate expectations after the Jackson Hole meeting have affected copper prices less than they have the gold and silver markets. Copper prices dropped by 0.72% last Friday, but most of the losses were recovered on Monday.
Long-Term Copper Trend Remains Bullish Above $6.00
The strong bullish momentum in the copper market is also observed on the quarterly chart. The chart shows a strong bottom at the support of the ascending channel pattern that stretches from the 2002 lows. This ascending channel pattern was already broken in Q2 2026, and the price has already reached the resistance of the second ascending channel pattern.
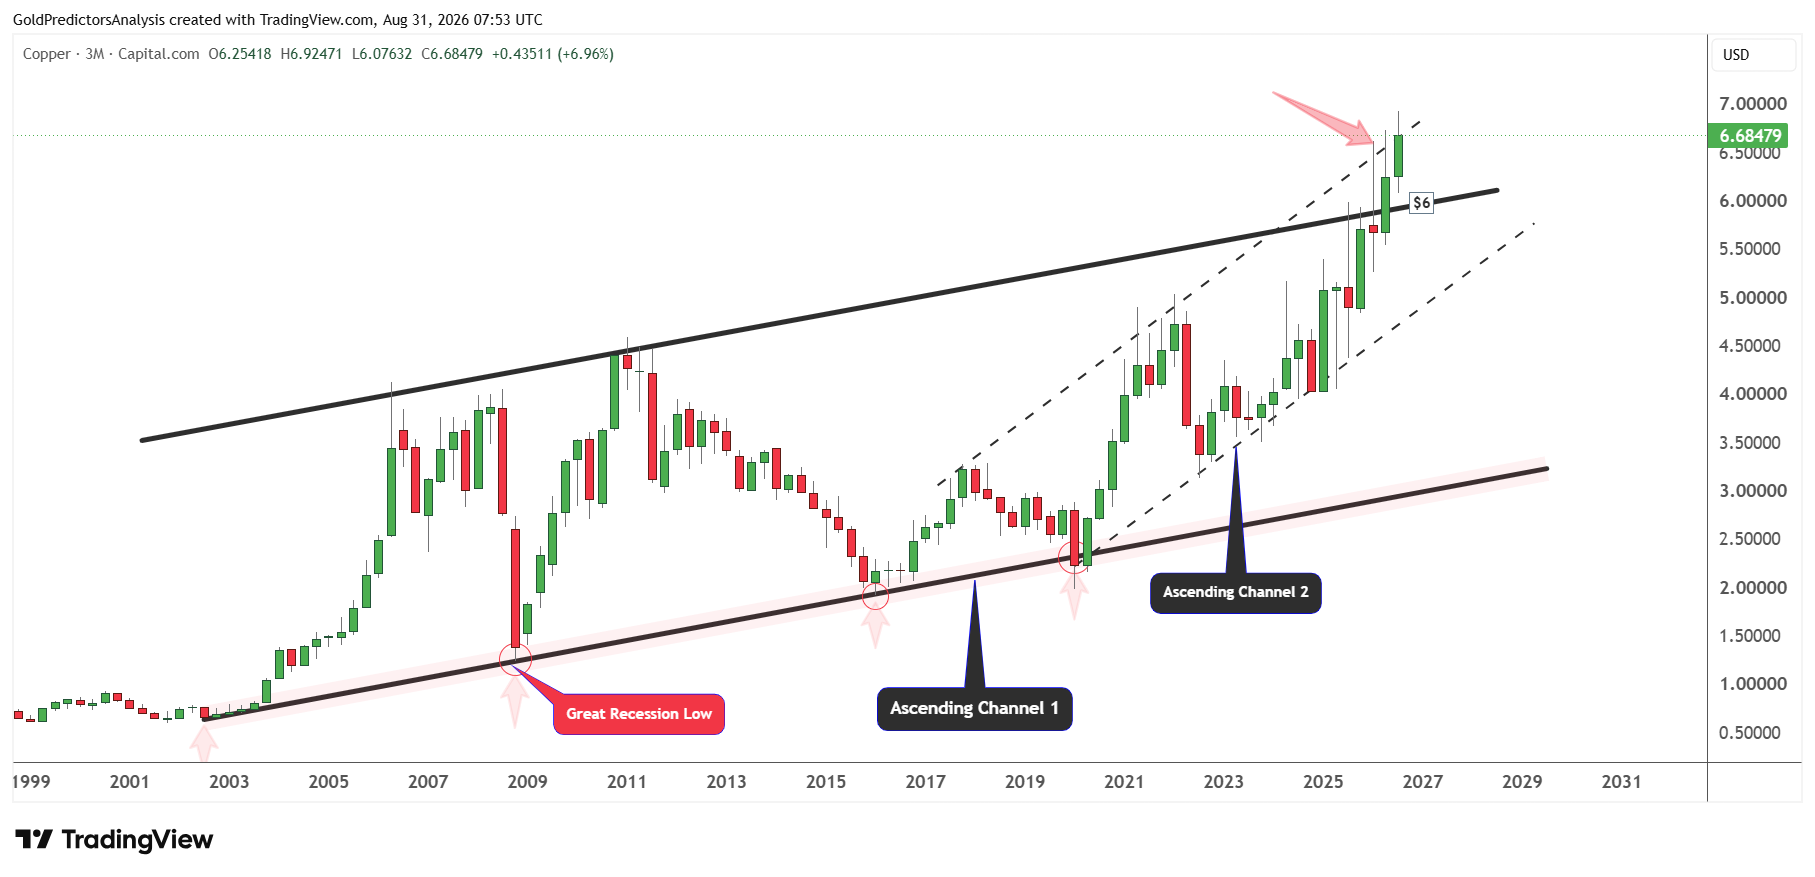
The constructive quarterly candles for Q2 and Q3 indicate that copper prices have a lower probability of a correction in the short term and will move higher. But if profit-taking occurs at resistance near $7.00, the price may find strong support around $6.00 and move further higher. The important long term support in the copper market remains $5.00 and $6.00. If the price corrects to this level, it may offer a strong pivotal point for long term investors.
Silver-to-Copper Ratio Signals Silver Outperformance
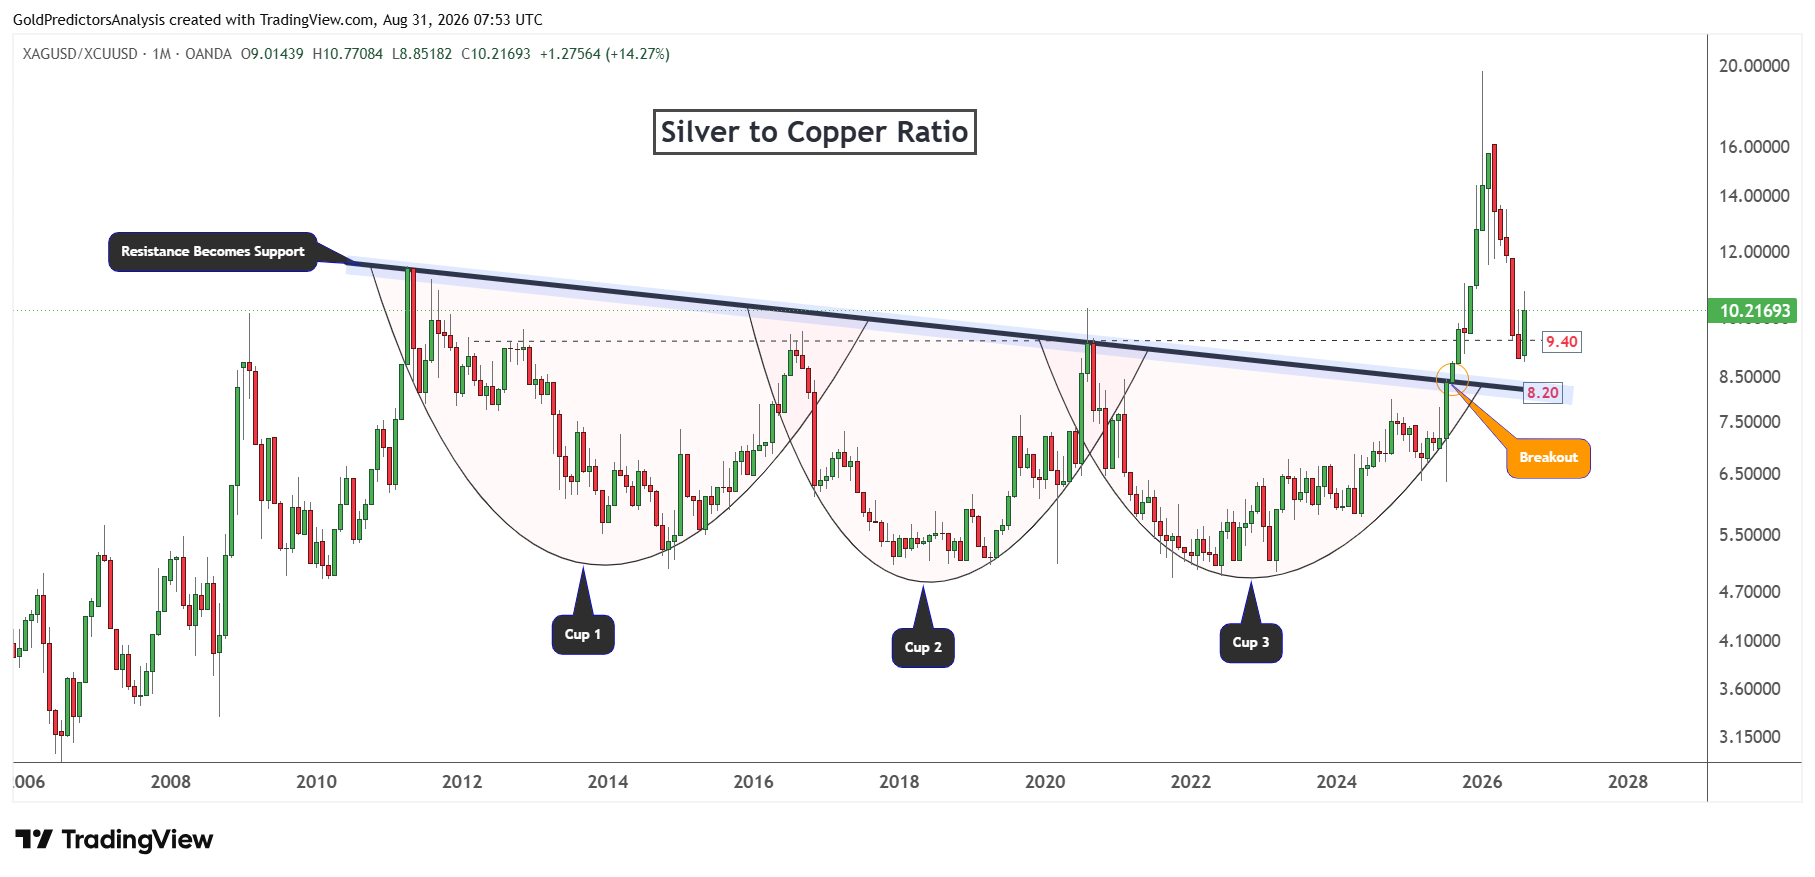
The silver to copper ratio has shown constructive price action since 2011. This constructive price action is seen through the formation of a rounding cup pattern from the 2000 highs. The ratio broke above the descending trend line at 8.40 in 2025 and triggered a strong surge to mark a high in January 2026.
This peak in the ratio occurred when silver prices formed a top at $120 in January 2026. After that, silver prices dropped and corrected toward the $50 support. The ratio also fell back toward the key support zone at 9.40. But the strong rebound from 9.40 in August 2026 suggests that silver prices are again ready to outperform copper.
Copper demand is driven by strong fundamentals related to AI infrastructure. If copper continues to rally, then another rally in the silver to copper ratio could allow both metals to move higher and silver will likely outperform copper.
Bottom Line
The copper outlook remains positive, but the macro environment is mixed. The manufacturing data for China improved and offered some support for demand. But the weakness in construction and real estate shows that a full recovery has not yet started. The stronger U.S. dollar and rising expectations of another Fed rate hike could also limit gains in the short term.
The technical structure remains bullish while copper holds above $6.00. A clear break above $6.90 could open the way toward $7.50. If profit-taking begins near $7.00, then the $6.00 area should provide important support. AI infrastructure demand also supports the long term outlook, while the silver to copper ratio suggests that both metals could rise and silver should lead the move.
Read more: Copper Eyes a $7 Breakout