



Through August, gold climbed and so did the crowd behind it, week after week, until specs owned more of COMEX than they have in almost any week of the last eight years. That reading is dated the day the rally stopped. I think the unwind isn’t finished, and I’m putting my level at $4,280 into the September meeting.
The Crowd Peaked on the Same Session the Price Did
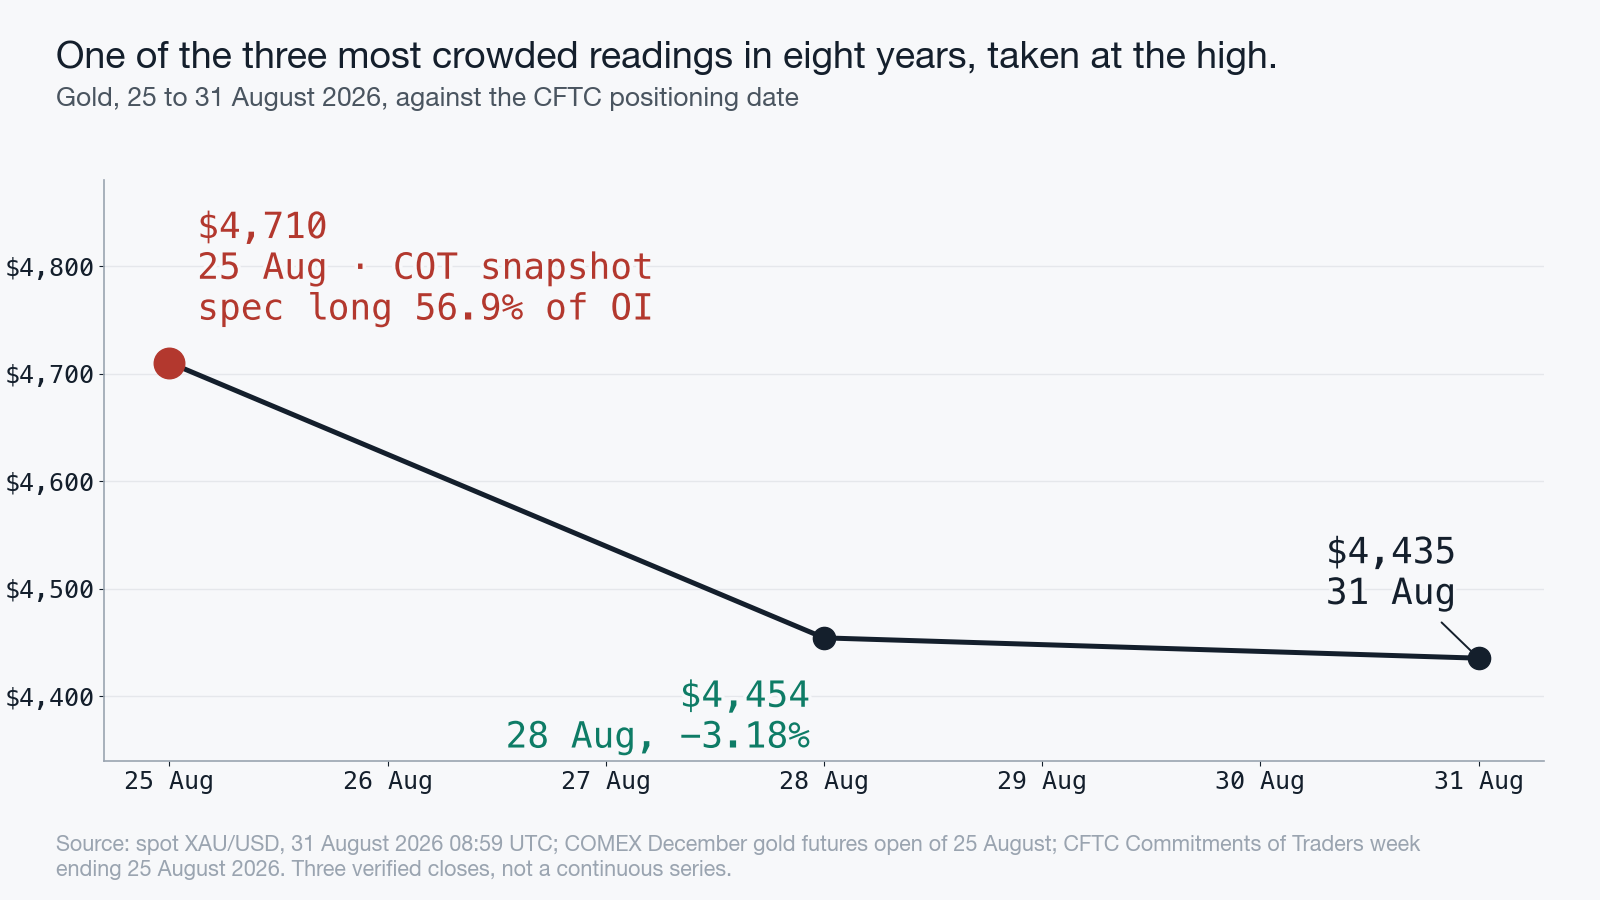
I’ll take the sequence in order. December gold opened $4,710.10 on Tuesday 25 August, a three month high. That Tuesday is also the date stamped on the Commitments of Traders report, because the CFTC snaps positions on a Tuesday and publishes the Friday after.
On the 28th gold fell 3.18% in a session as the dollar rallied on Warsh. By Monday the 31st it was $4,435.18, down another 0.44%, which is 5.8% below the Tuesday high, and only 0.57% above the $4,410 floor of the entry zone I want.
So one of the three most crowded readings in eight years was taken at the top, and gold is 5.8% lower four sessions later. I get the next COT snapped on Tuesday 1 September, published Friday the 4th. Nobody has seen the unwind yet. Not one report of it.
Gold Price Forecast
Every new Gold analysis as it publishes, today's technical signal and key levels, live price — on one page.
See all Gold forecastsI Went Looking for a Record and Found a Different One
Here is where I nearly wrote the wrong sentence. My instinct was that a net long of 243,334 contracts must be an extreme, so I pulled all 400 weekly reports back to 2018 and ranked it before building anything on it. That was wrong, and the ranking is what showed me.
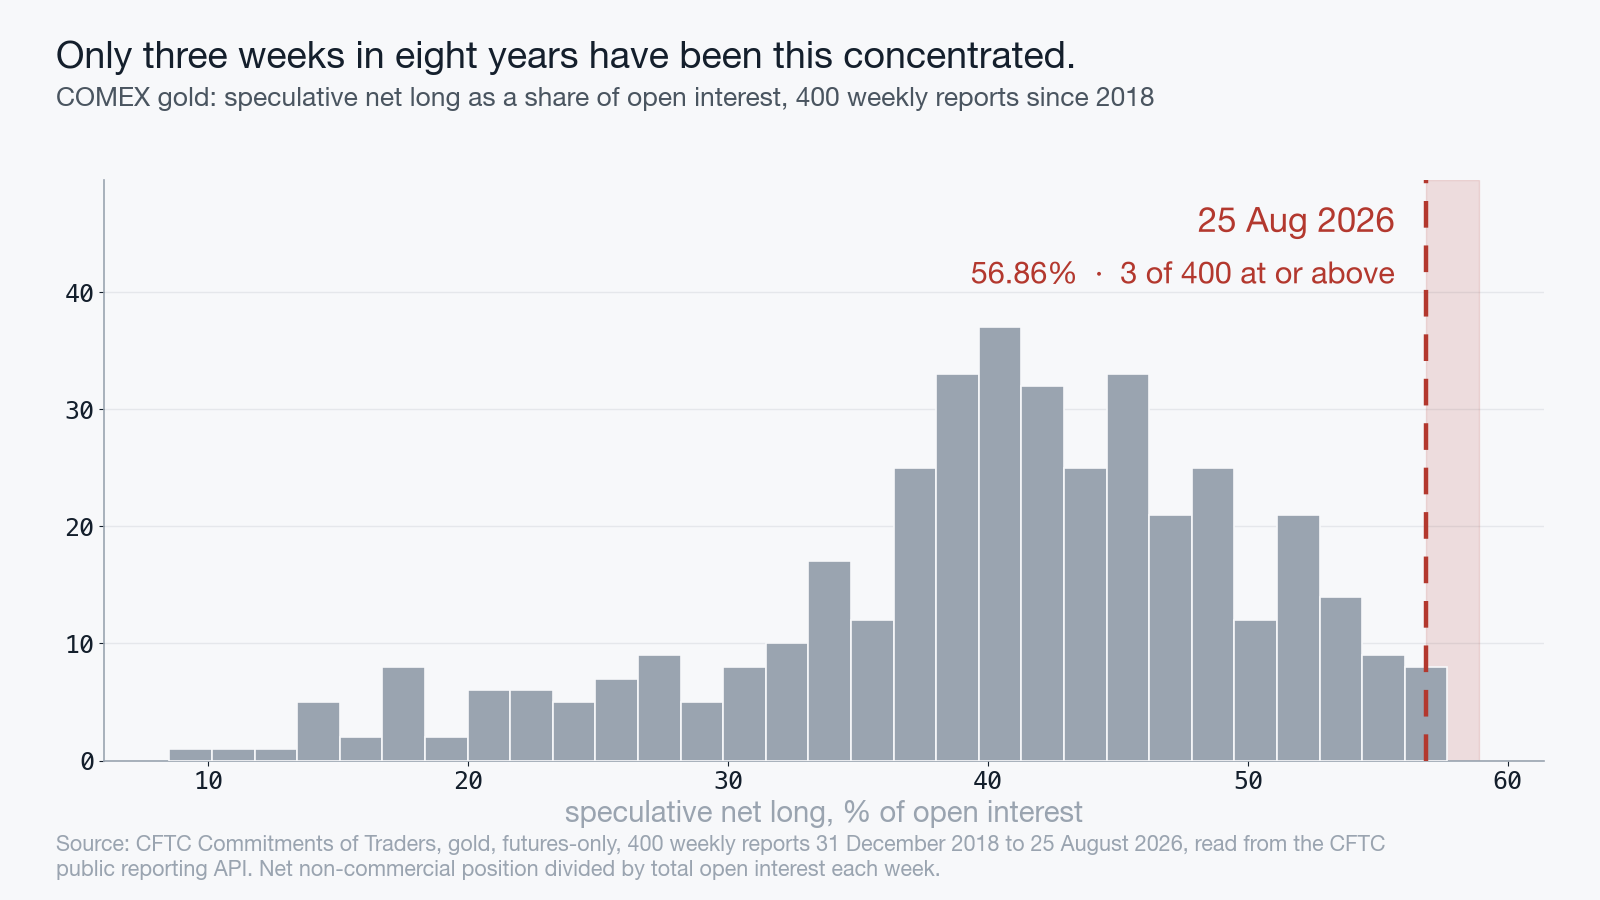
On the raw number this position sits in the 70th percentile, against a mean of 203,219 and barely two thirds of a standard deviation above it. It isn’t an extreme at all. Traders have been more long than this many times, and it hasn’t meant a thing. My record is in the ratio. Measured against open interest, the net long is 56.86%, and I count only three of 400 reports ever sitting at or above it. Three weeks in eight years. The all time high is 57.67%, set in September 2024, which is 0.81 points away. On the long to short ratio it is 8.19 to one, the 96.8th percentile. And I checked the obvious objection, which is that a ratio can be flattered by a shrinking market. It didn’t. Open interest grew from 384,603 to 427,957 over the four weeks of the climb.
Both sides expanded, and I make the long side the faster of the two. So this is a genuine concentration, i.e. not an arithmetic artefact, and that’s why I’m writing it.
Financial Analysis
Positioning: Four Straight Weeks in One Direction
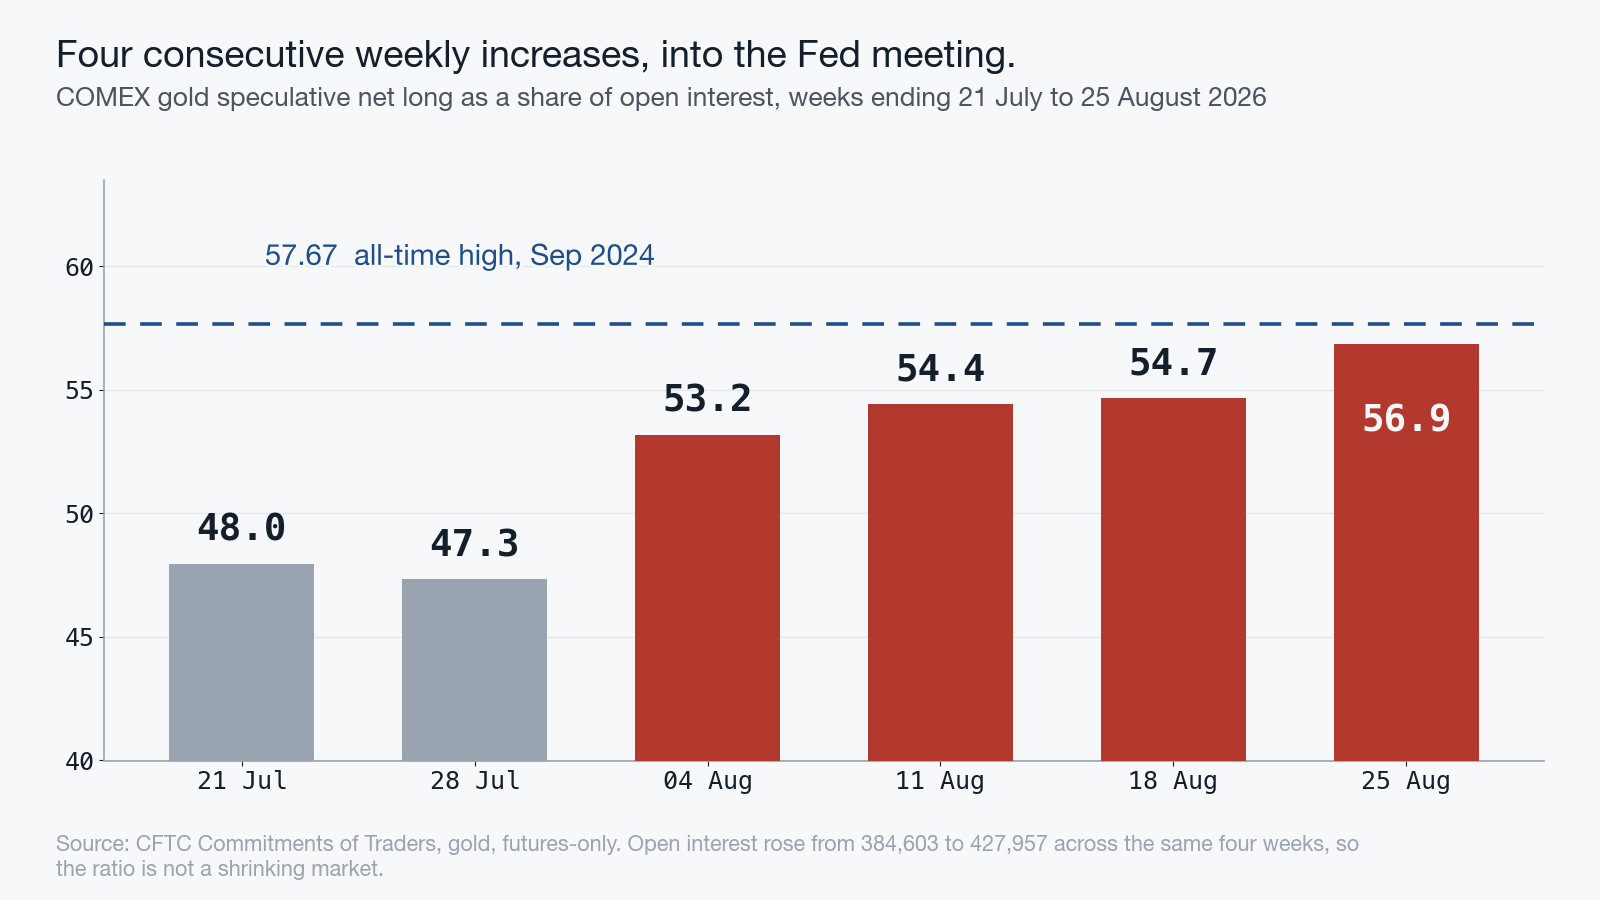
This climb isn’t a single print. Net long as a share of open interest bottomed at 47.3% on 28 July, then ran 53.2, then 54.4, then 54.7, and 56.9% on 25 August. Four consecutive weekly increases into a Fed meeting, with the long to short ratio going from 5.9 to one up to 8.2 to one over the same stretch.
What I take from that is an asymmetry in who is left to act. At 8.2 longs for every short there is almost nobody positioned to be squeezed higher, and a very large number of people positioned to be squeezed lower. The 3.18% session on 28 August is what that looks like when it starts. I’d rather own that as the mechanism than dress it as a forecast: crowded positions don’t fall because they’re crowded. They fall further once something makes them move.
Fundamentals: The Fed Is the One Thing This Position Cannot Absorb
Gold doesn’t pay a coupon, so its case weakens when the market prices higher rates for longer. That is the whole of it, and September is where it gets tested.
Chair Warsh’s Jackson Hole remarks put the numbers on the table himself: PCE at 3.7% on the twelve month and 4.1% on the six. Six months running hotter than twelve is the arithmetic of an inflation that is speeding up, and he said so in front of the room that prices it, adding that “we must be confident that underlying inflation is moving to our objective, clearly and at sufficient speed. Otherwise, we have work to do.”
Futures moved from roughly a third priced for a September hike to nearly six in ten within the session, and that repricing is the part that reaches gold directly. Gold fell 3.18% the same day. Same session. Markets have already shown, once, what this position does when the Fed turns hawkish, and the meeting itself is still sixteen days away.
Position and Risk
In my view the September meeting meets a gold market whose ownership is more one sided than at almost any point since 2018, and the unwind is four sessions old rather than finished.
- Asset: gold, spot XAU/USD.
- Direction: lower.
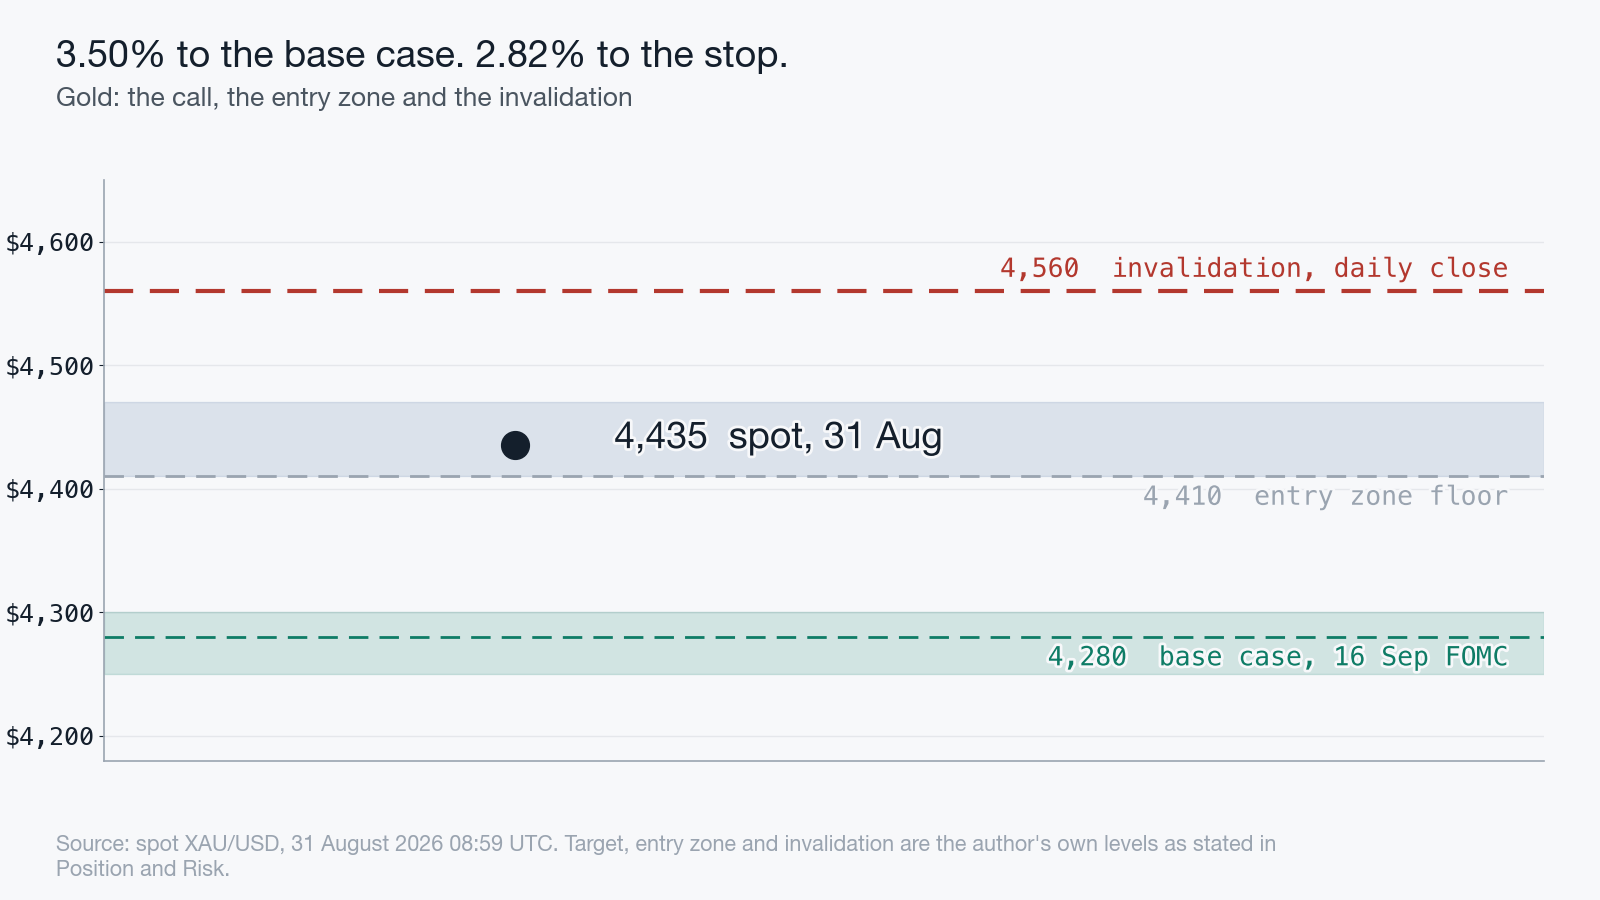
- Target: $4,250 – $4,300, base case $4,280.
- Timeframe: by the 16 September FOMC.
- Fair entry: $4,410 – $4,470, i.e. the zone it is trading in now.
- Invalidation: a daily close above $4,560.
Arithmetic on that is 3.50% to the base case against 2.82% to the stop, so roughly 1.24 to one, and I’d rather state my ratio than let it read better than it is. The $4,410 floor of that entry zone is my first test on the way. Losing it confirms the setup. It doesn’t complete it.
Risks, dated. The Fed holds on the 16th, which is roughly two in five in current pricing and would hand gold back everything the hawkish repricing took. August payrolls on 4 September and CPI on Friday 11 September are the two prints that can settle the hike question before the meeting, and a soft one on either does the same job. And here is the strongest argument against me, which I won’t wave away: this position has been at similar concentration before without breaking, most recently at the all time record in September 2024, and a crowded long in a bull market is a description, i.e. an observation about ownership and nothing more. It needs the Fed to keep pushing. That is the bet.
Conclusion
I expect gold at $4,250 to $4,300 by 16 September, through $4,410, on an unwind of one of the three most concentrated speculative longs the COMEX record holds. My mechanism is ownership, i.e. who holds what: at 8.2 longs per short there is very little fuel above and a great deal of it below.
Further out, the interesting part is what the ratio does after the meeting. If the Fed hikes and the position still doesn’t clear, then this is a structural bid that survives higher real yields, and the case for gold through 2027 is stronger than the bulls are arguing. Two of my colleagues on this masthead published targets of $5,000 and $9,000 in the last week, and they might well be right on a twelve month view. My disagreement is about the next sixteen days, and about who has to sell first. Order matters here. The next Commitments of Traders report lands on Friday 4 September, and it’s the first that can show whether the crowd has started to leave.