



The S&P 500 to gold ratio is rebounding as investors rotate back into large-cap stocks after a strong period for gold. In my view, this recovery shows that improving liquidity and inflation linked earnings are supporting risk assets in the short term. But gold (XAU) still holds its long term hedge value. This article presents the historical capital rotation between the S&P 500 and gold, the latest rebound in the stock market and the key levels that may determine whether gold or equities lead next.
S&P 500-to-Gold Ratio Reveals Major Capital Rotation Cycles
The chart below shows the S&P 500 to gold ratio over the past century. This ratio increases when the stocks perform better than gold. It declines when the performance of gold is better than that of stocks. The data on this chart presents a great message. The significant peaks in this ratio are observed around turning points in the financial system. When these peaks form, the capital tends to shift away from equities and move towards gold.
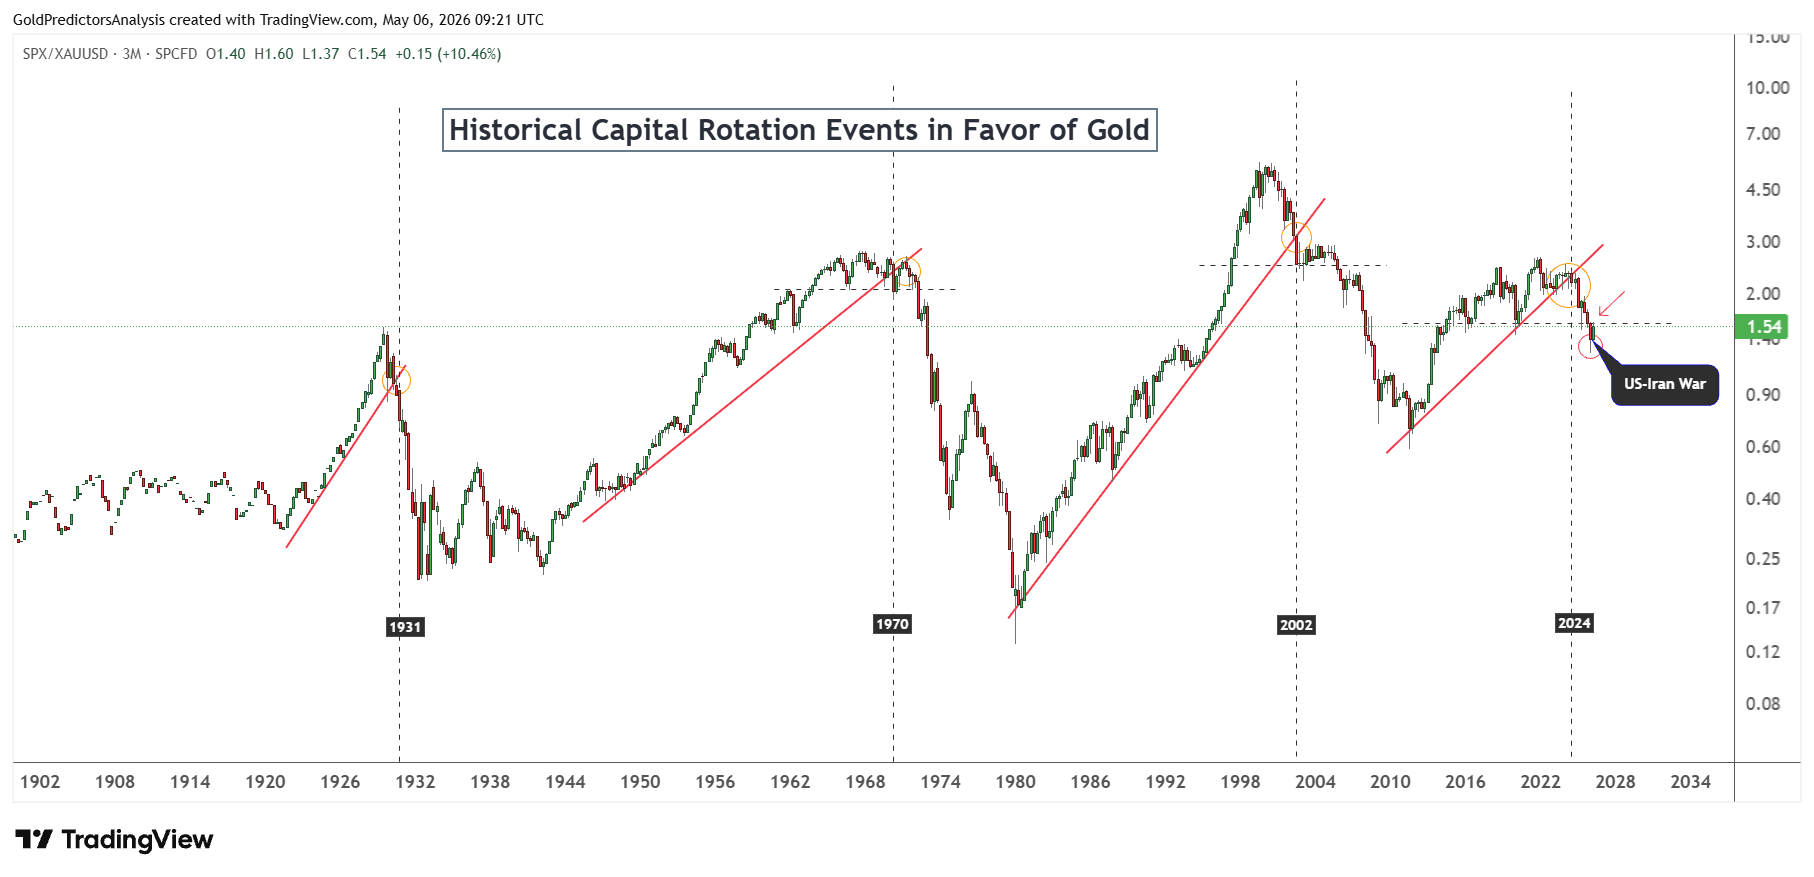
1931: Great Depression Drove Investors Toward Gold
The first significant rotation developed around 1931. The ratio had surged in the 1920s when stocks attracted huge capital flows. However, this tendency was interrupted during the great depression. Equities weakened by banking stress, deflation, liquidation of debt and failing confidence. The importance of gold has increased as investors seek a safe place against financial turmoil.
This was also developed around the significant changes to the U.S. gold policy of the 1930s. The U.S. subsequently responded with emergency bank legislation and the Gold Reserve Act of 1934, which revalued gold and increased government control over the monetary system. The capital rotation was not just a market correction. It was monetary regime shock. Gold gained importance because trust in financial assets weakened.
S&P 500 Price Forecast
Every new S&P 500 analysis as it publishes, today's technical signal and key levels, live price — on one page.
See all S&P 500 forecasts1971 Bretton Woods Breakdown Strengthened Gold’s Role
The second significant rotation occurred in the period 1970-1971. The ratio had shot up during the equity growth in the post-war period. But the structure was altered as inflation ensued and the pressure mounted on the dollar. In August 1971, President Richard Nixon suspended the dollar convertibility to gold. This decision ended core mechanism of the Bretton Woods and pushed the world towards a fiat currency system.
The above chart shows that the ratio broke down after this period. Inflation, oil shocks and economic uncertainty of the 1970s posed challenges to stocks. Gold was the more powerful asset since it cushions investors against currency debasement and against negative real returns.
2000–2002: Dot-Com Bust Triggered a Major Gold Bottom
The third significant peak hit around 2000-2002. The ratio approached historic high close to the dot-com bubble peak. The investors were largely invested in technology stocks and growth stocks. Gold was ignored. However, the bubble had burst, the U.S. had entered recession and money had begun to exit overvalued equities.
It was also a significant bottom in gold. Gold began a protracted bull market, and S&P 500-to-gold ratio plummeted. The recession of 2001 and the events of September 11 also boosted demand for safe havens.
2024 Gold Breakout Signalled a New Capital Rotation
The fourth major rotation started in 2024. Another breakdown in the S&P 500 to gold ratio during lengthy equity recovery was observed in the above chart. This time, the driver was more than a stock market bubble. It was also combination of the inflation pressure, debt stress, geopolitical risk and strong official sector gold demand.
In 2024, Gold set record highs on multiple occasions. According to data from the World Gold Council, the central banks purchased a large amount of gold which pushed the gold demand to an all-time high. This serves to elaborate on the fact that gold outperformed large-cap stocks during the recent decline in the ratio.
A new development is now evident in the chart. The S&P 500 to gold ratio has recovered most recent low after the U.S.-Iran war. This implies that capital is no longer flowing into gold. Large-cap stocks are once again attracting money as investors seek assets that can be used to take advantage of inflation, fiscal spending, AI investment and defence spending.
S&P 500-to-Gold Ratio Tests Key Stock Market Recovery Zone
The S&P 500 to gold relationship can also be understood by using the price structure in the chart below. The ratio peaked near 5.47 around 2000–2001. This was a big warning. It demonstrated how high stocks prices were compared to gold prices. Since then, the ratio has fallen away and settled around 0.67 in the region of 2011 for over 10 years.
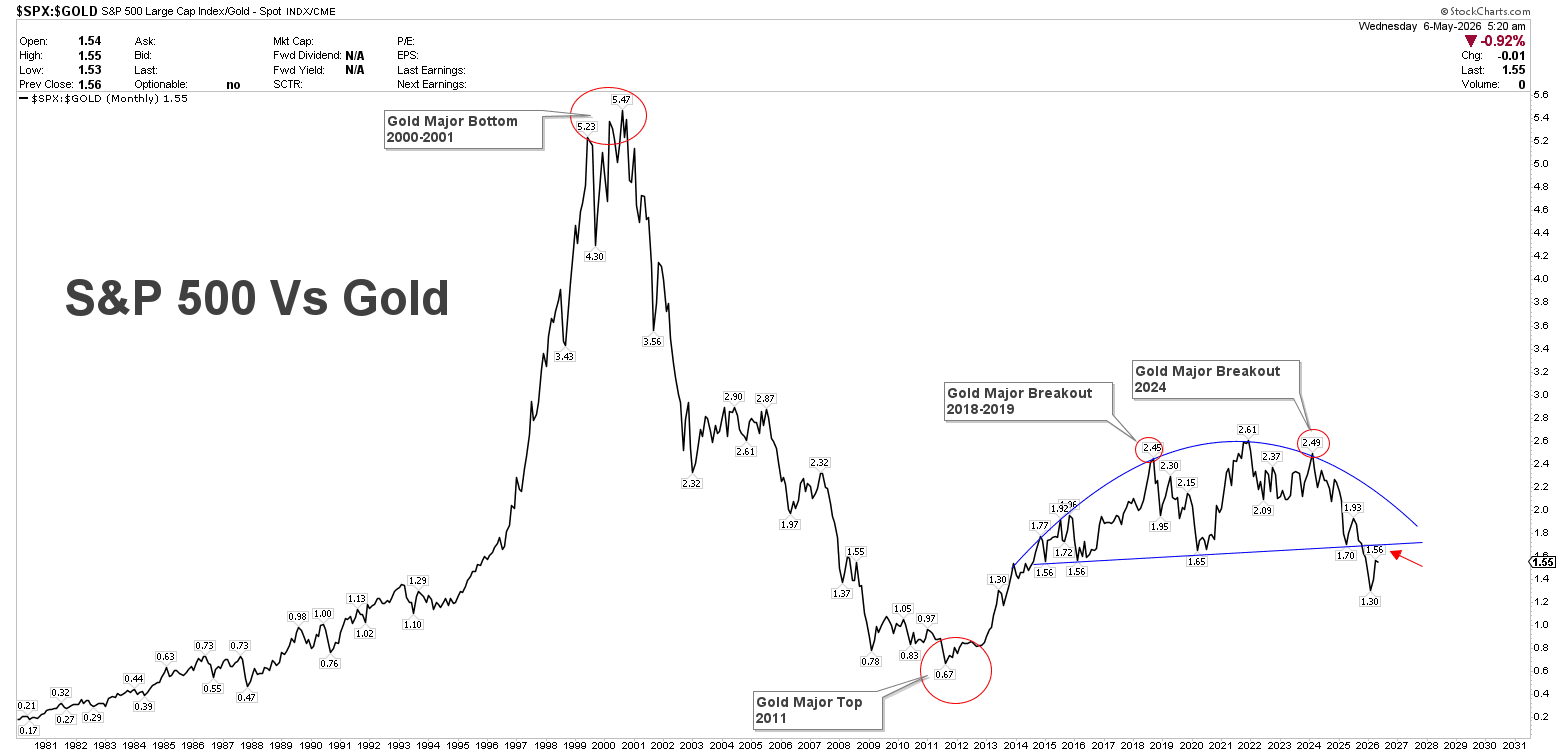
This 2011 low was a large top when compared to the stock market. The gold market had enjoyed a hot bull trend for several years following the dot-com bubble, the 2008 financial crisis and years of loose monetary policies. When the fear fade and equities rebounded, the S&P 500 took over. The ratio then climbed from 2011 to 2018–2019 and again toward 2021–2022.
The chart shows two significant gold breakout zones. The first lies in the vicinity of the 2.45 level in 2018/2019. The second one is around 2024 in the area of 2.49. These points have resulted a strong breakout in the gold market whereby the stock market produced a correction.
Overall, gold performed very well in the 2024-2026 period, as seen by the recent pullback to 1.30. However, the latest recovery to slightly below 1.57 is significant. The ratio has re-crossed the lower boundary of the long-term rounding top structure and is coming back to the blue support trendline. A successful break above 1.70 will indicate that the gold price has formed a medium term top at $5,600 and is ready for a deeper correction. However, a continuation of the negative trend in this ratio from current levels will trigger stronger surge in the gold market in 2026.
From the technical perspective, the ratio is likely to decline which indicates a surge in gold prices to $7,000.
SPX-to-Gold Ratio Rebounds as War and Liquidity Drive Rotation
The short term recovery in the ratio from 1.30 to 1.55 is observed on the chart below. The ratio had reached a significant bottom point around early March 2026. This came just a few days after the U.S.-Israeli attack on Iran. Since then the ratio has created a set of higher lows and higher highs. It is also stuck above the 1.50 resistance level.
This is a worthwhile breakout. The ratio had been limited to 1.50 in the early part of the year. This breakout indicates that the S&P 500 is looking to resume its lead over gold. The recent reading of 1.55 is a good sign of an active recovery. It also implies that investors are purchasing safe havens. They are easing into larger cap stocks that can benefit from inflation related revenues, AI capital expenditures, onshoring, defence spending and robust nominal earnings.
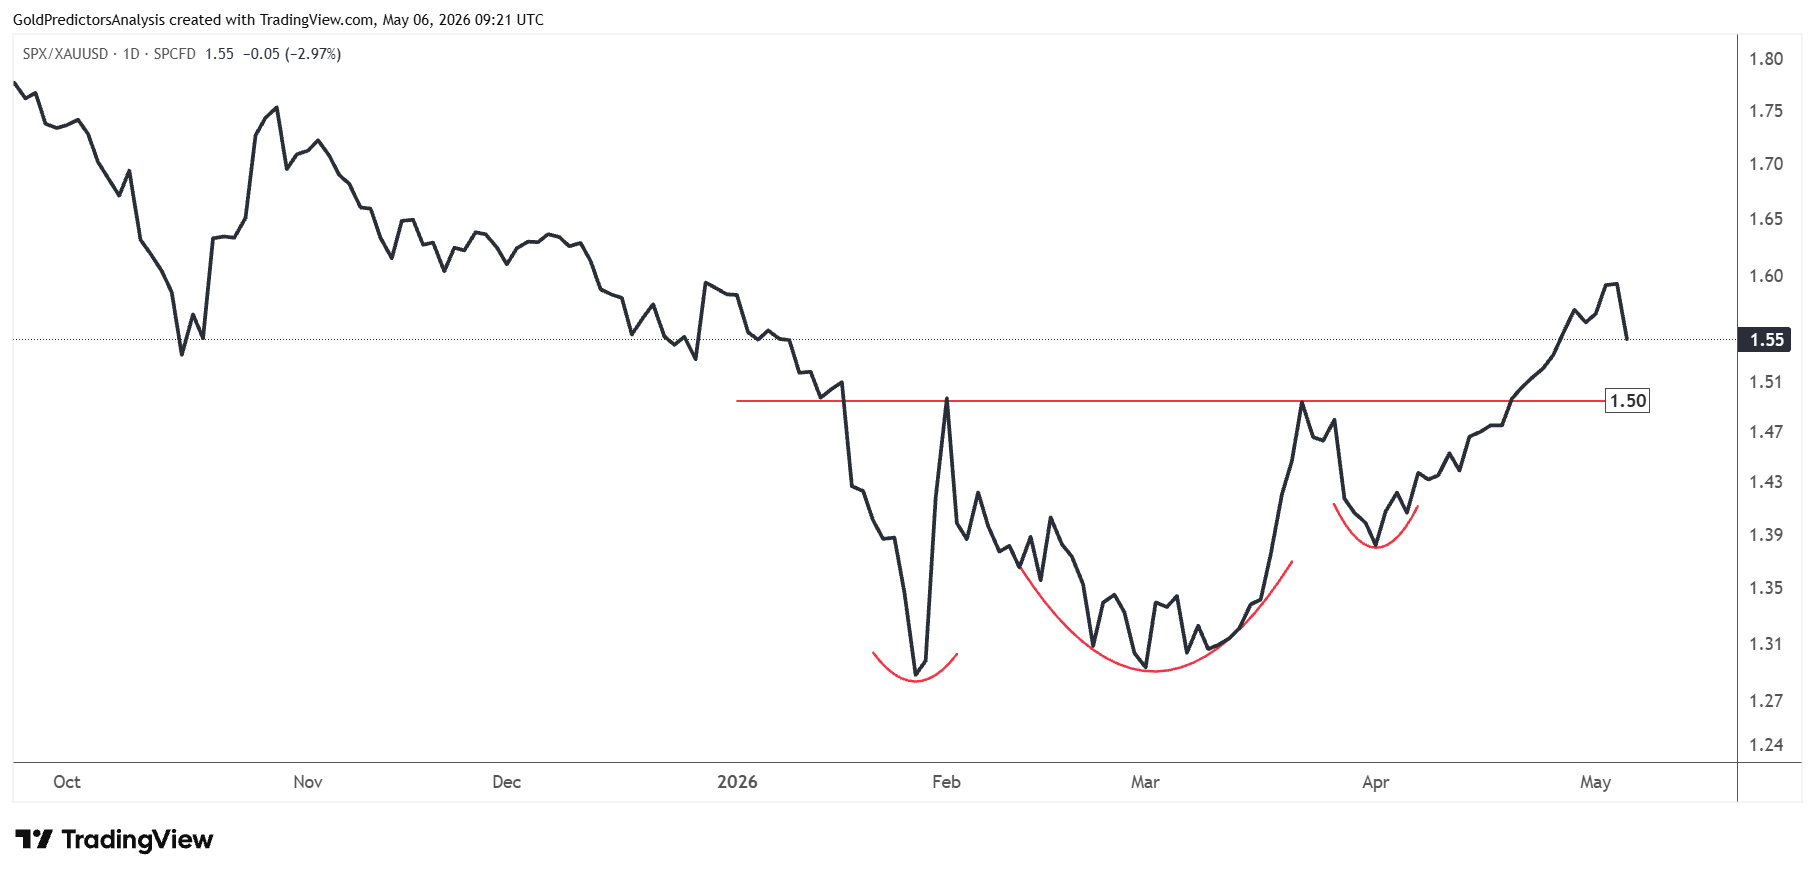
This shift develops within the broader downtrend due to the U.S.-Iran war, which is the primary catalyst in 2026. Gold typically leads the way in a normal geopolitical shock. This war has also alleviated inflationary pressures from energy risk and supply-chain stress. This alters the market response. If inflation threat increases, investors could choose to purchase gold before any other investment. They can later switch into large-cap stocks if the revenues of the firms increase with slight changes in prices.
Loose Liquidity Supports the S&P 500 Breakout
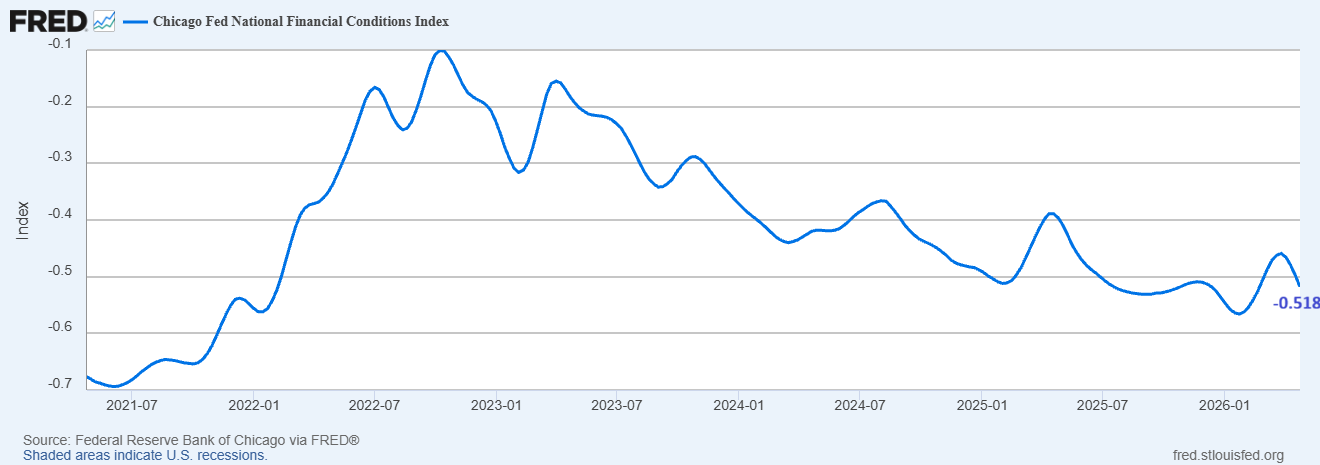
This rotation is also supported by liquidity. According to the data, the Chicago Fed National Financial Conditions Index has fallen to -0.518. The negative scores below -0.40 represent loose financial conditions. The loose financial conditions favour risk assets. The surge in Bitcoin (BTC) above $80,000 also suggests the loose financial conditions.
The chart below shows that the S&P 500 (SPX) has broken the key level of 7,000 after forming a V-shaped recovery above the long term support of 6,200. This breakout suggests the target of 8,000 with the 7,000 as new support.
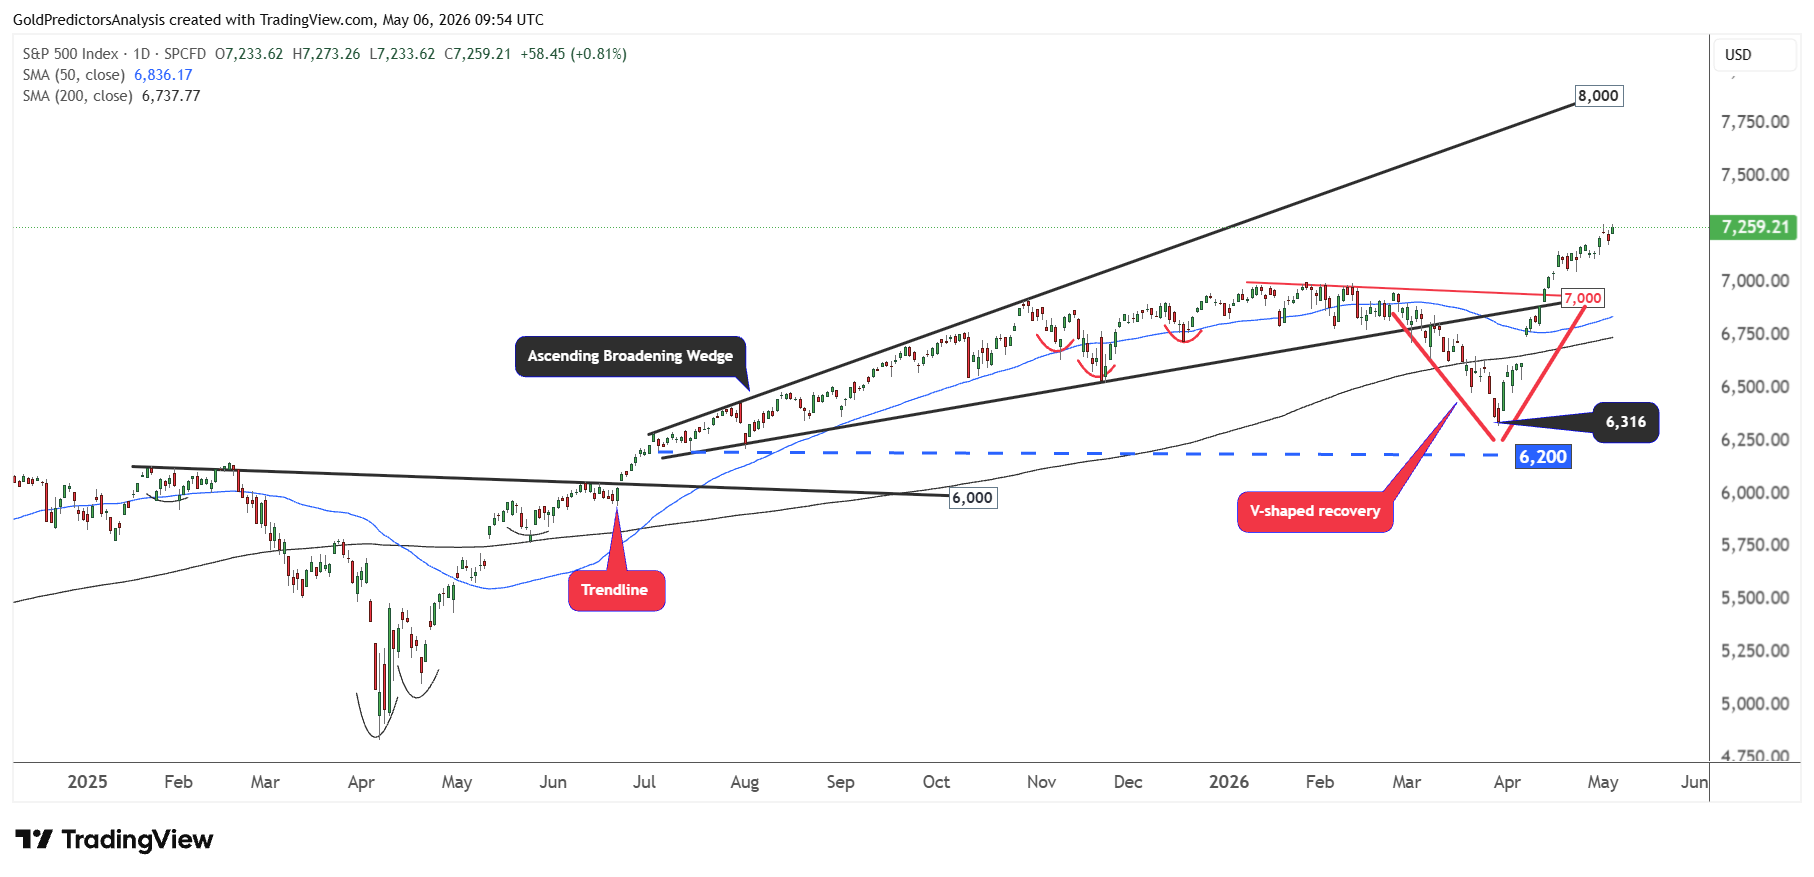
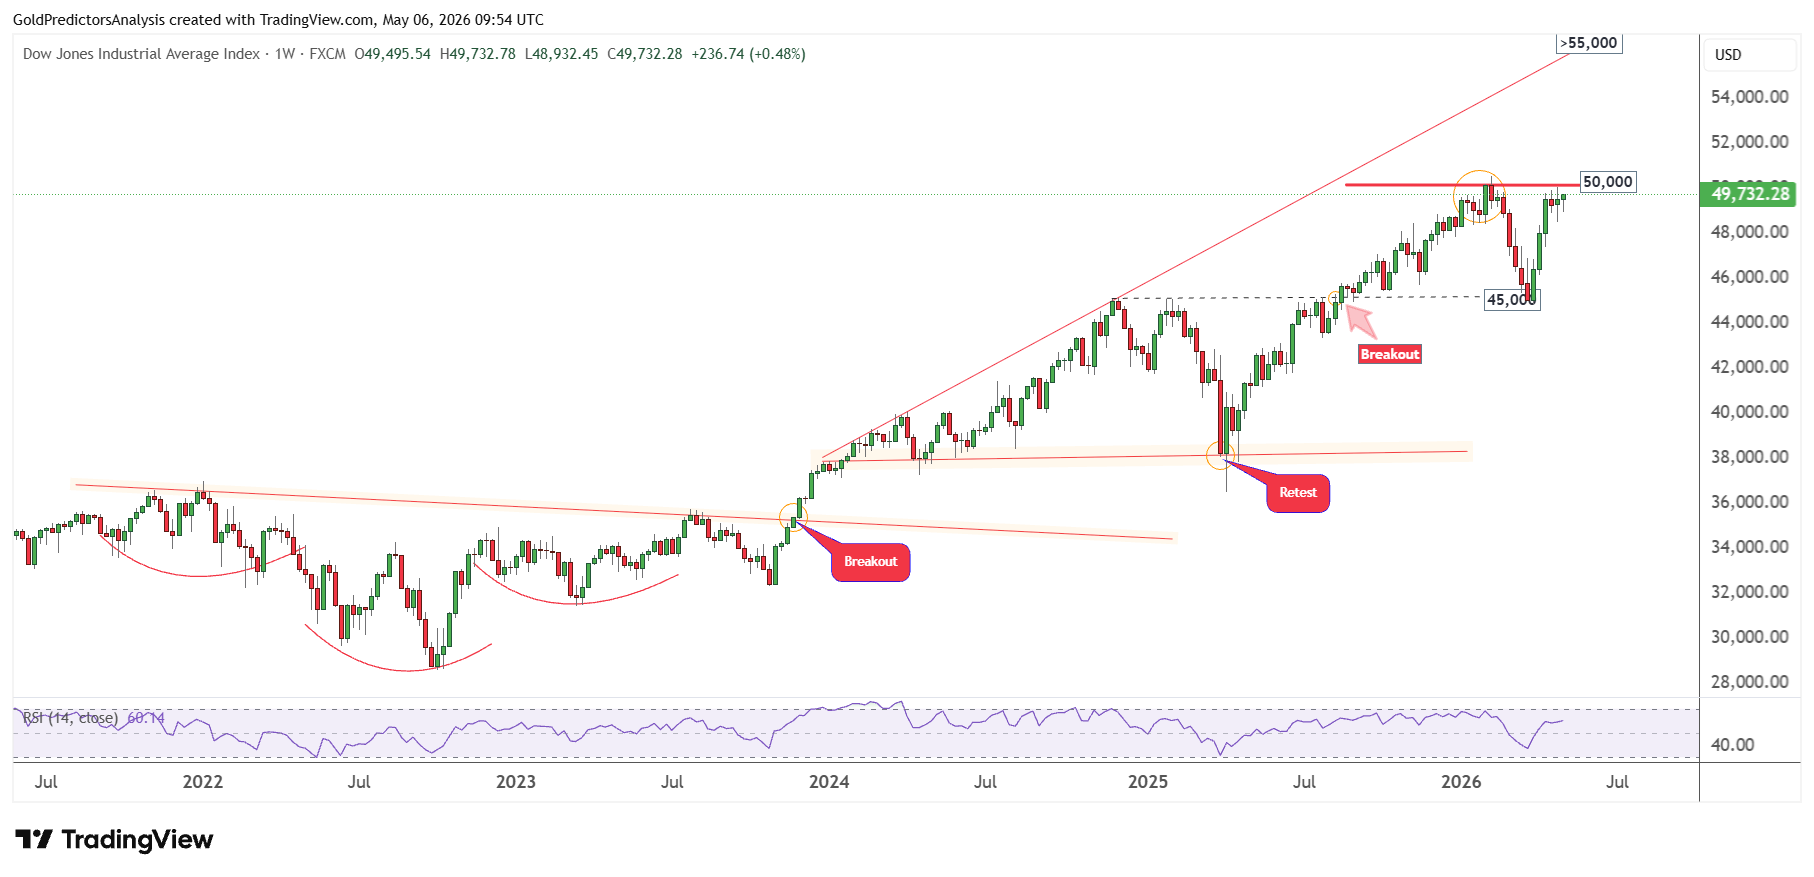
However, the Dow Jones 30 did not break above the key 50,000 which keeps the risk profile active in the US stock market. However, the price compression below the key of 50,000 indicates the likelihood of upside breakout in the Dow Jones. The break above 50,000 in Dow Jones will target the 8,000 level in S&P 500.
Gold Keeps Its Long-Term Hedge Role
Despite these developments, the greatest value of gold is still as a strategic hedge. The U.S. economy is still fragile. The confidence of consumers is low. The inflation outlook is improving. Fiscal deficits are still high. The pressure is mounting on the debt burden. Financial repression is a long-run policy for the government that may be necessary to manage debt. That suggests the long-term interest rates are lower than the inflation rate. Negative real rates would make the real debt load lower but would also make the currency’s purchasing power lower.
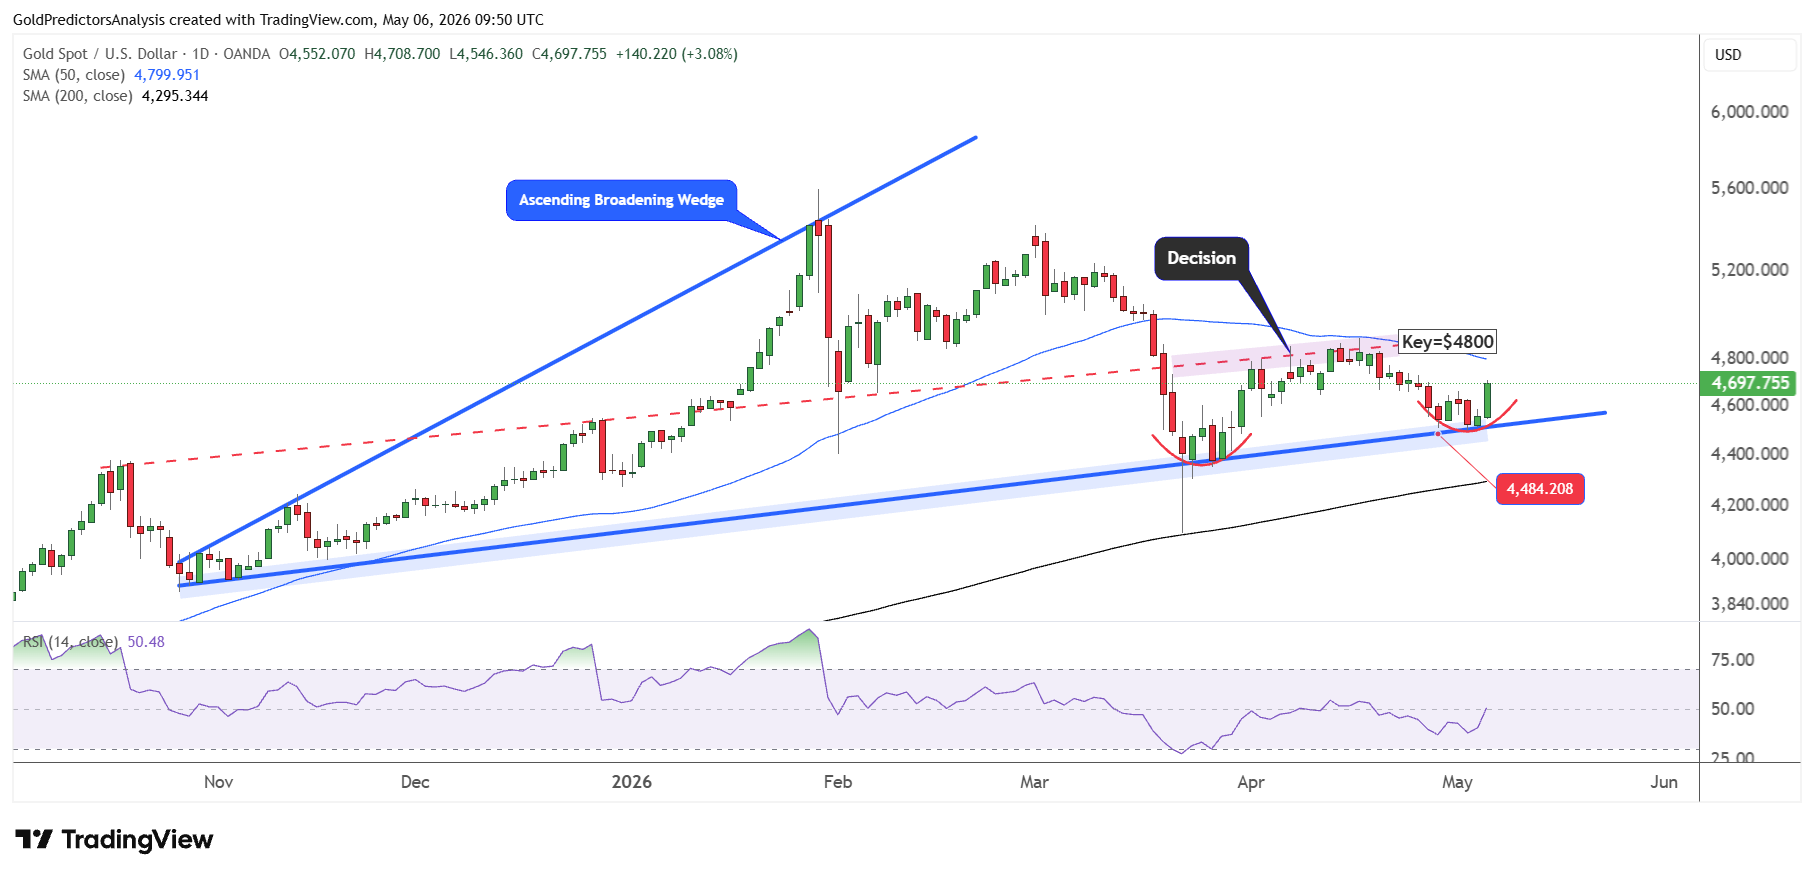
The chart below shows that the gold price has formed a strong bottom at the support of $4,500 and rebounded higher. The strong recovery from this support indicates that the gold price holds bullish momentum. The short term target in spot gold remains the $4,800. A break above $4,800-$5,000 will indicate another rally to the $5,600 zone. This positive price action indicates that the S&P 500-to-gold ratio will likely continue lower after hitting resistance at 1.70.
Final Thoughts
The S&P 500 to gold ratio is a good indicator of the shifting of capital from risk assets to defensive assets. The recent uptick in the ratio indicates that investors are coming back to large-cap stocks due to an uptick in liquidity and earnings which are supported by inflation-linked revenues. The surprise rally in the S&P 500 also reinforces positive risk sentiment. But this is not a process of eradicating market risk. The Dow Jones still must confirm the move and the overall ratio is in a long-term structure where gold has shown leadership.
The case for gold as a strategic hedge is strong due to high debt, low consumer confidence, policy pressure and currency debasement. The bull market has returned with bounce from the $4,500 support area which suggests that buyers are still active in the market. If the price breaks $5,000, the rally may resume to $5,600. Therefore, the stocks can do better in the near term if liquidity continues to improve. Despite the surge in stocks, gold would be a better choice in the long run as inflation and debt stress persist.
If you’d like to know more about how to trade gold and silver, please visit our educational area.