EUR/USD
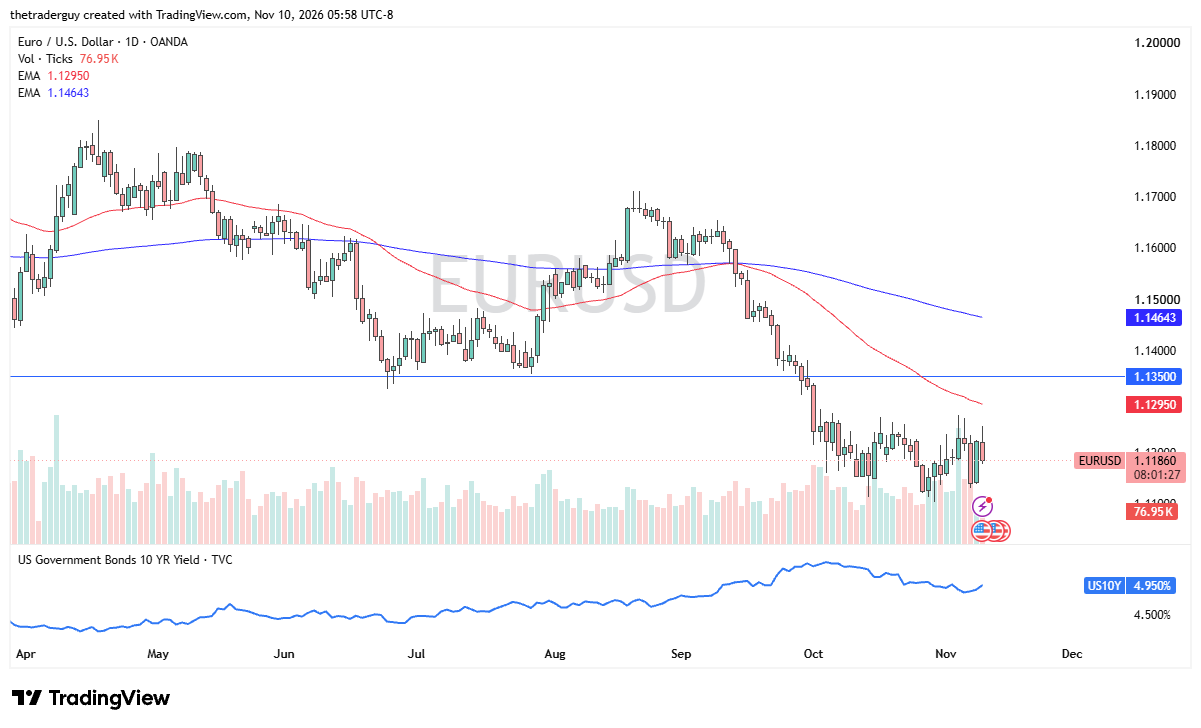
The euro initially tried to rally but gave back gains pretty quickly during the trading session on Tuesday. I think, at this point in time, anytime the euro rallies, we have to be looking to sell, especially if it’s near 1.12. Really, it’s not until we break above the 1.1350 level that I think anything has really changed.
With that being said, I continue to fade rallies. The CPI coming out hotter than anticipated during the trading session on Tuesday in America also brings in the case for a stronger U.S. dollar due to tighter Fed policy. Whether or not we break down through support today is a completely different question. I’m not necessarily looking for that, but I think short-term fading of the rally continues to be a big situation here.
USD/CAD
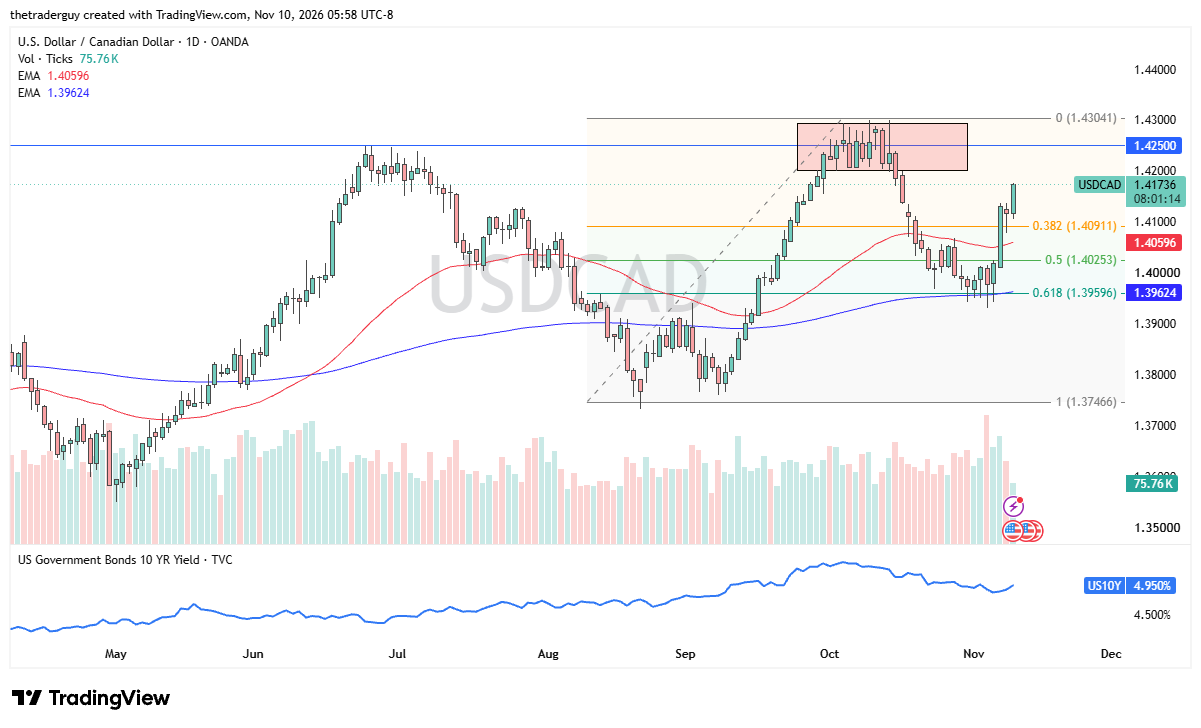
The U.S. dollar continues to rally against the Canadian dollar, and that makes sense. Again, the Canadian dollar has underperformed as oil has fallen. At the same time, we have situations where employment was a complete divergence between the two economies. The Canadians lost jobs, while the United States almost tripled what they were looking for.
So, I think this is a market that still works its way towards 1.4250, but it may take some time to get there. This isn’t exactly a high-flying market. I like short-term pullbacks for entries, but I remain long of that market.
Copper
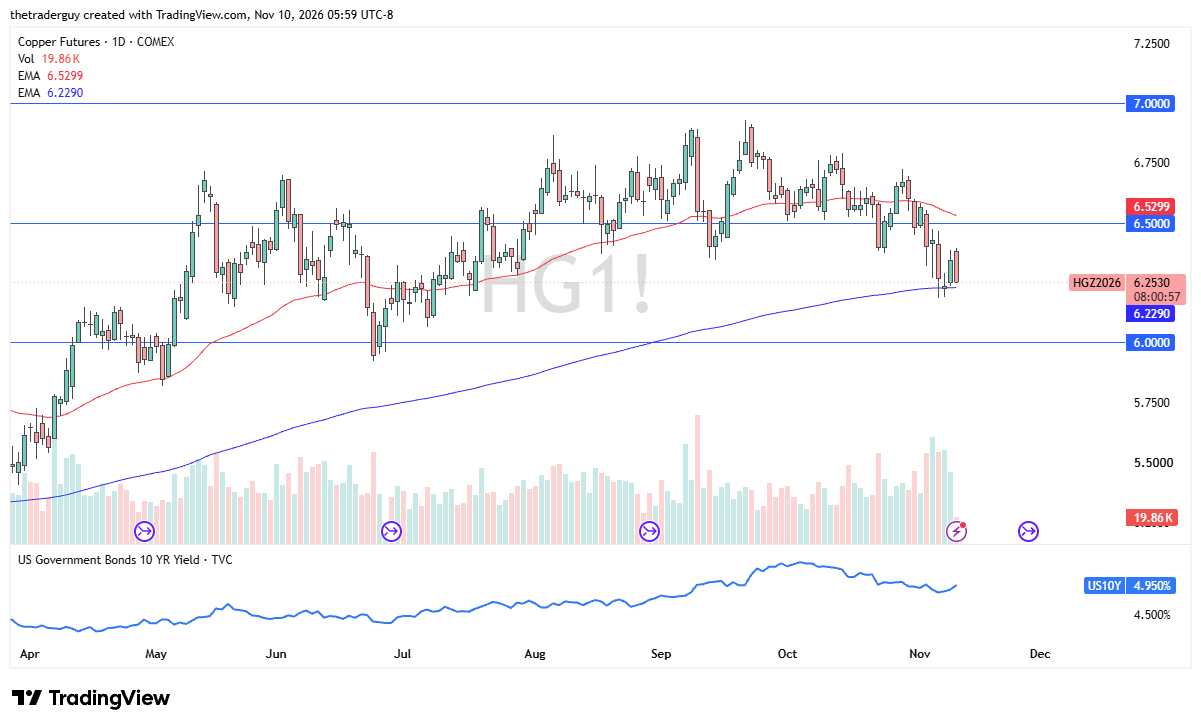
Copper has been kind of noisy during the trading session, with the tech rebound yesterday helping, but now again we’re worried about rates. We continue to bounce around the 200-day EMA. We’re currently in an area where I’m okay with buying copper. I wouldn’t put a ton of money into it, but I’m okay with trying to catch a bounce here.
We have a clear area underneath that could cause some issues. With that being said, the market is one that I’m okay with to the upside for a small position, a small trade. I’m not looking for anything major here. The clear exit would be if we make a fresh low.
EUR/USD Price Forecast
Every new EUR/USD analysis as it publishes, today's technical signal and key levels, live price — on one page.
See all EUR/USD forecasts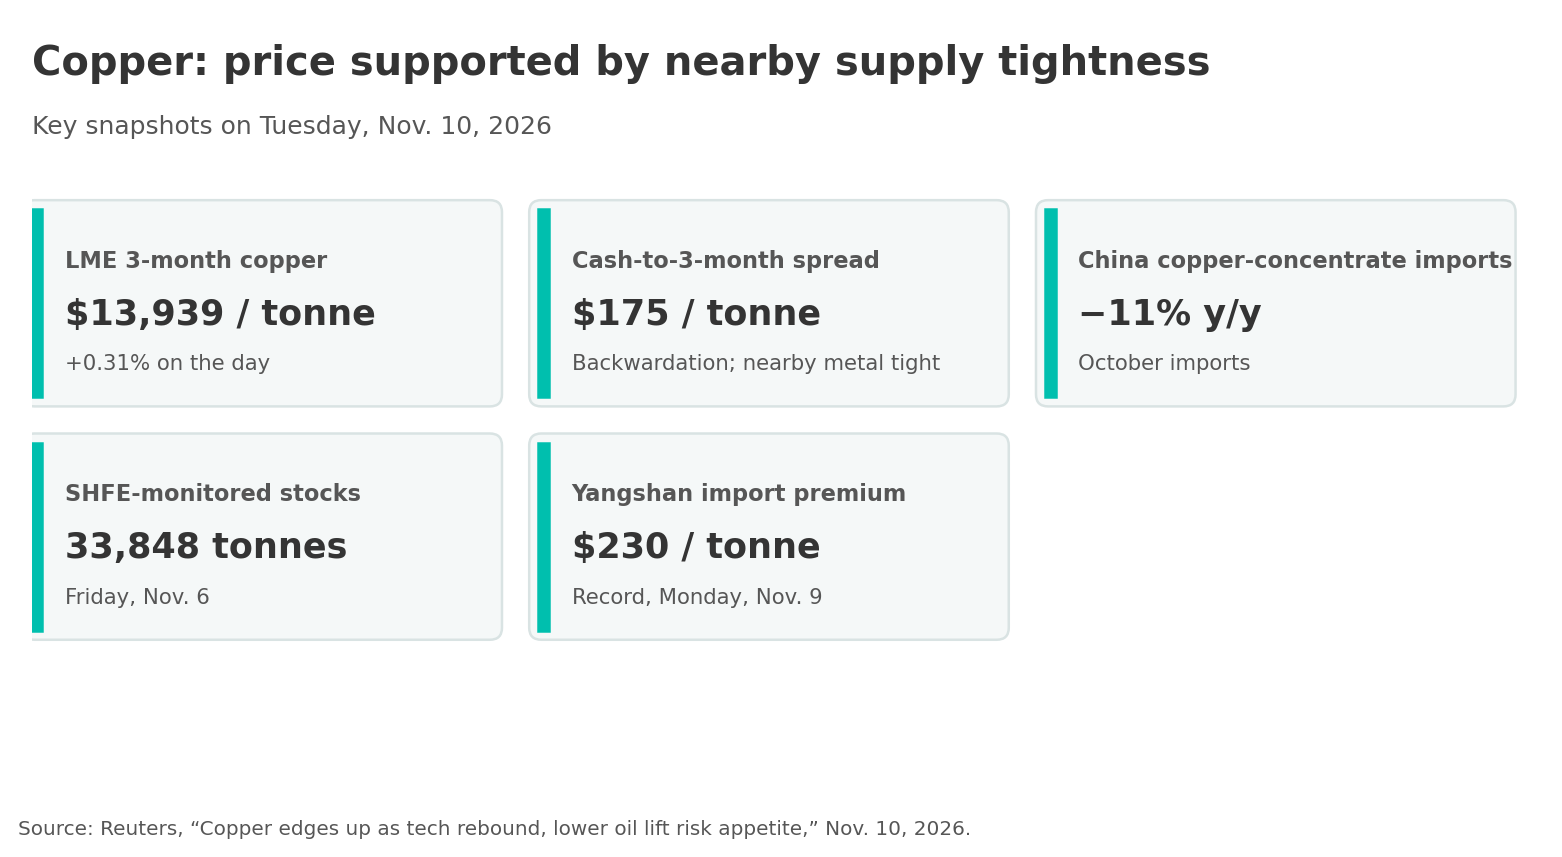
DAX
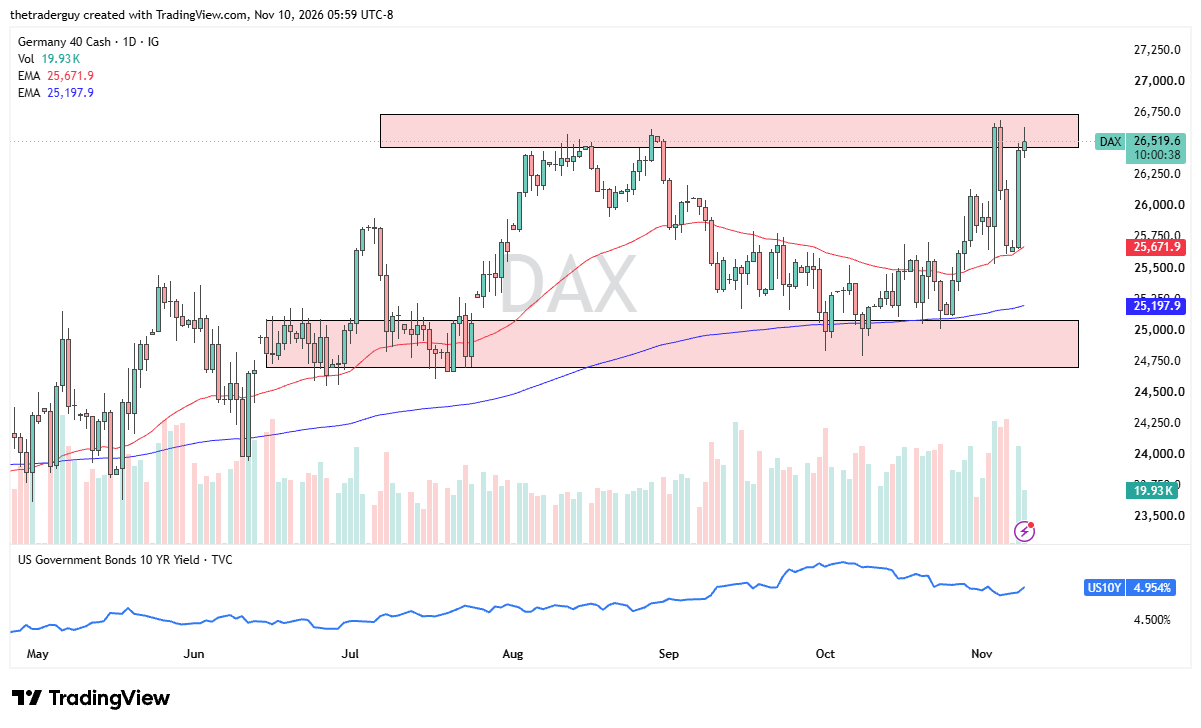
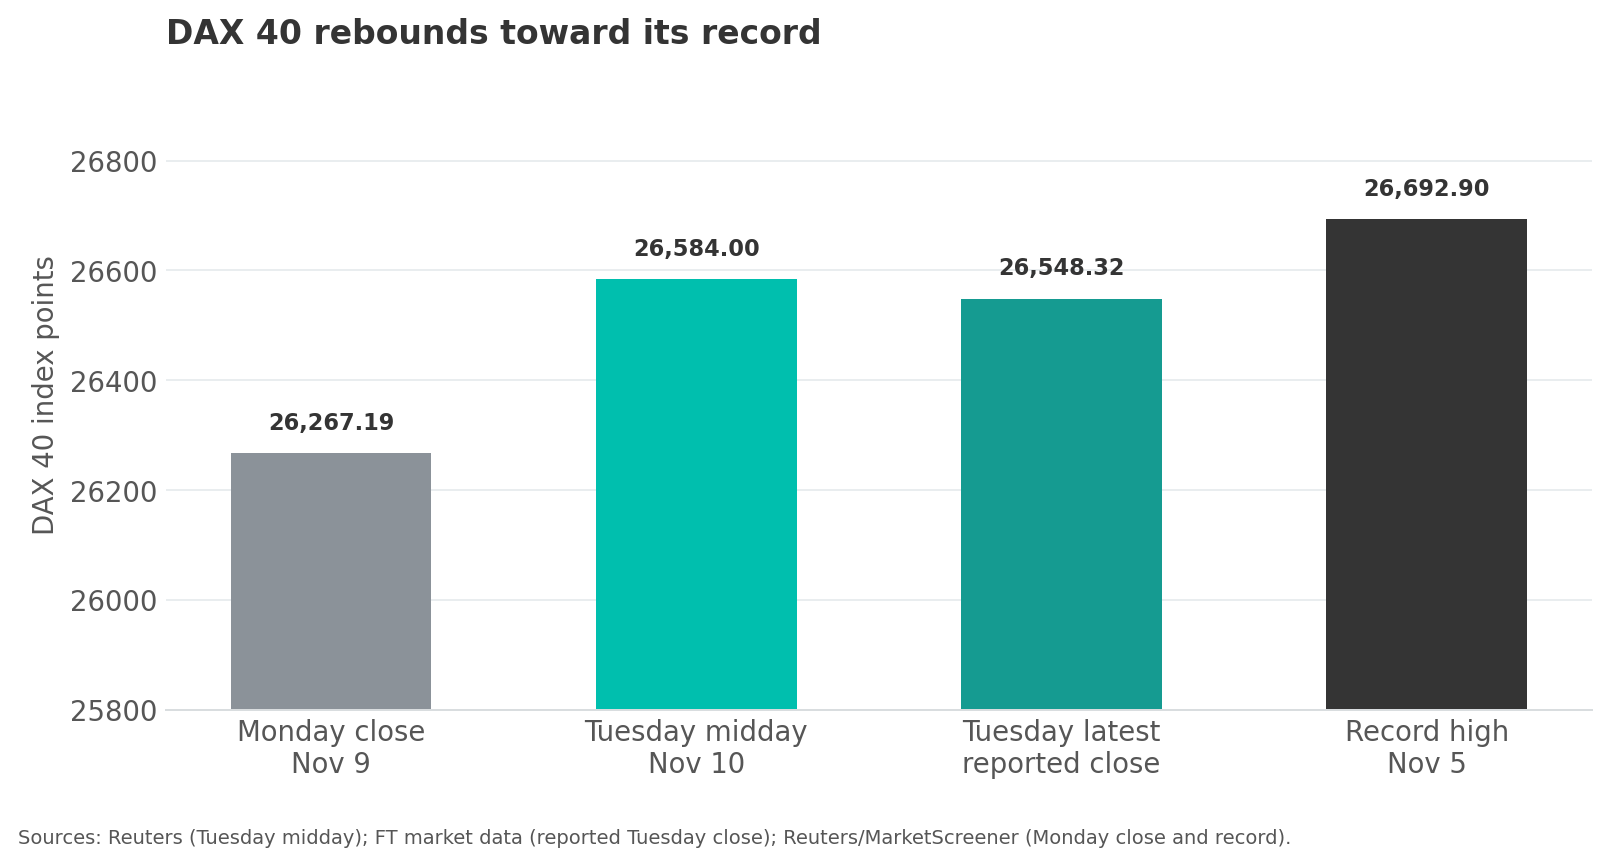
The DAX in Germany remains positive, but we are slamming into significant resistance. The DAX rising as oil continues to fall is a theme here. There are a lot of concerns about European energy over the winter, especially. But right now, I think there’s a barrier right around €26,750 that we need to get beyond in order to start seeing a bigger move.
At this point, a pullback makes sense, but I think that only offers a buying opportunity, especially if we can see this thing drop closer to 26,000. I don’t expect that today. It’s probably easier to break out than to get down there. But if we do break out to the €26,750 level, I’ll be buying that FOMO move.