


NASDAQ 100
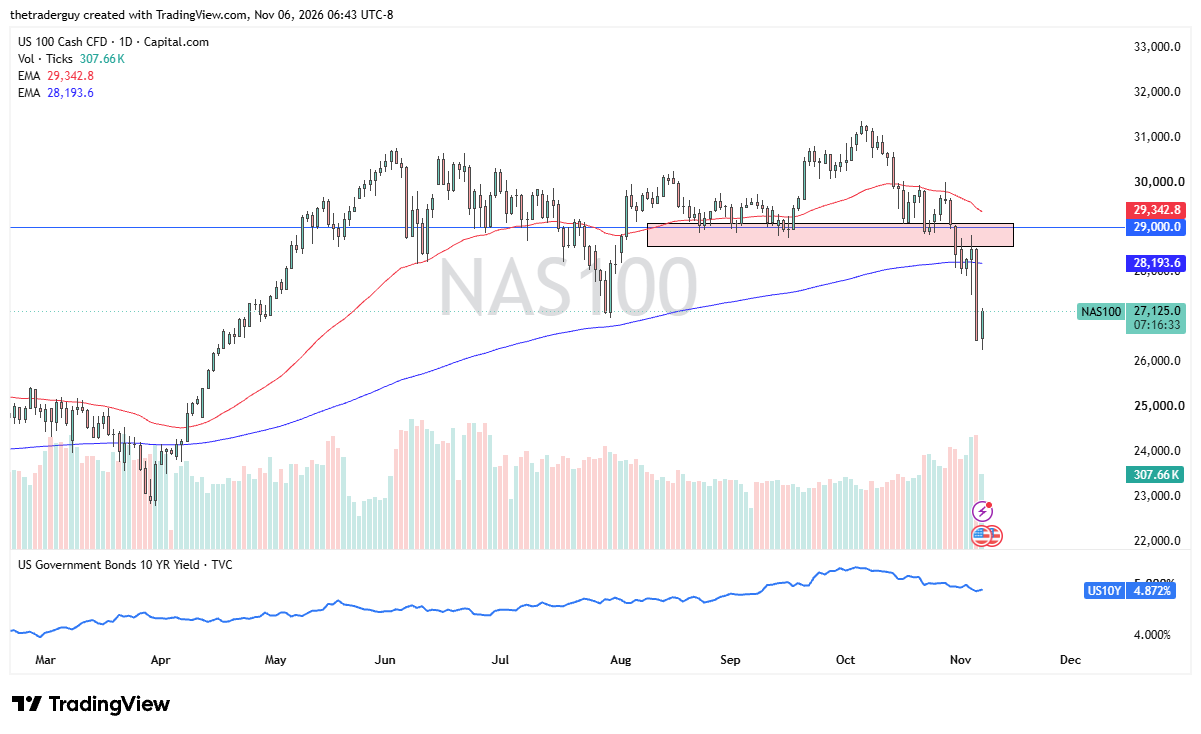
The NASDAQ 100 is the first place I’m looking at today. We have seen a little bit of a recovery, and hiring resilience will meet some earnings pressure here. The NASDAQ 100 is starting to see a little bit of a bounce during the trading session, as the BLS reported October payroll growth of 165,000 jobs added last month and unemployment of 4.1%.
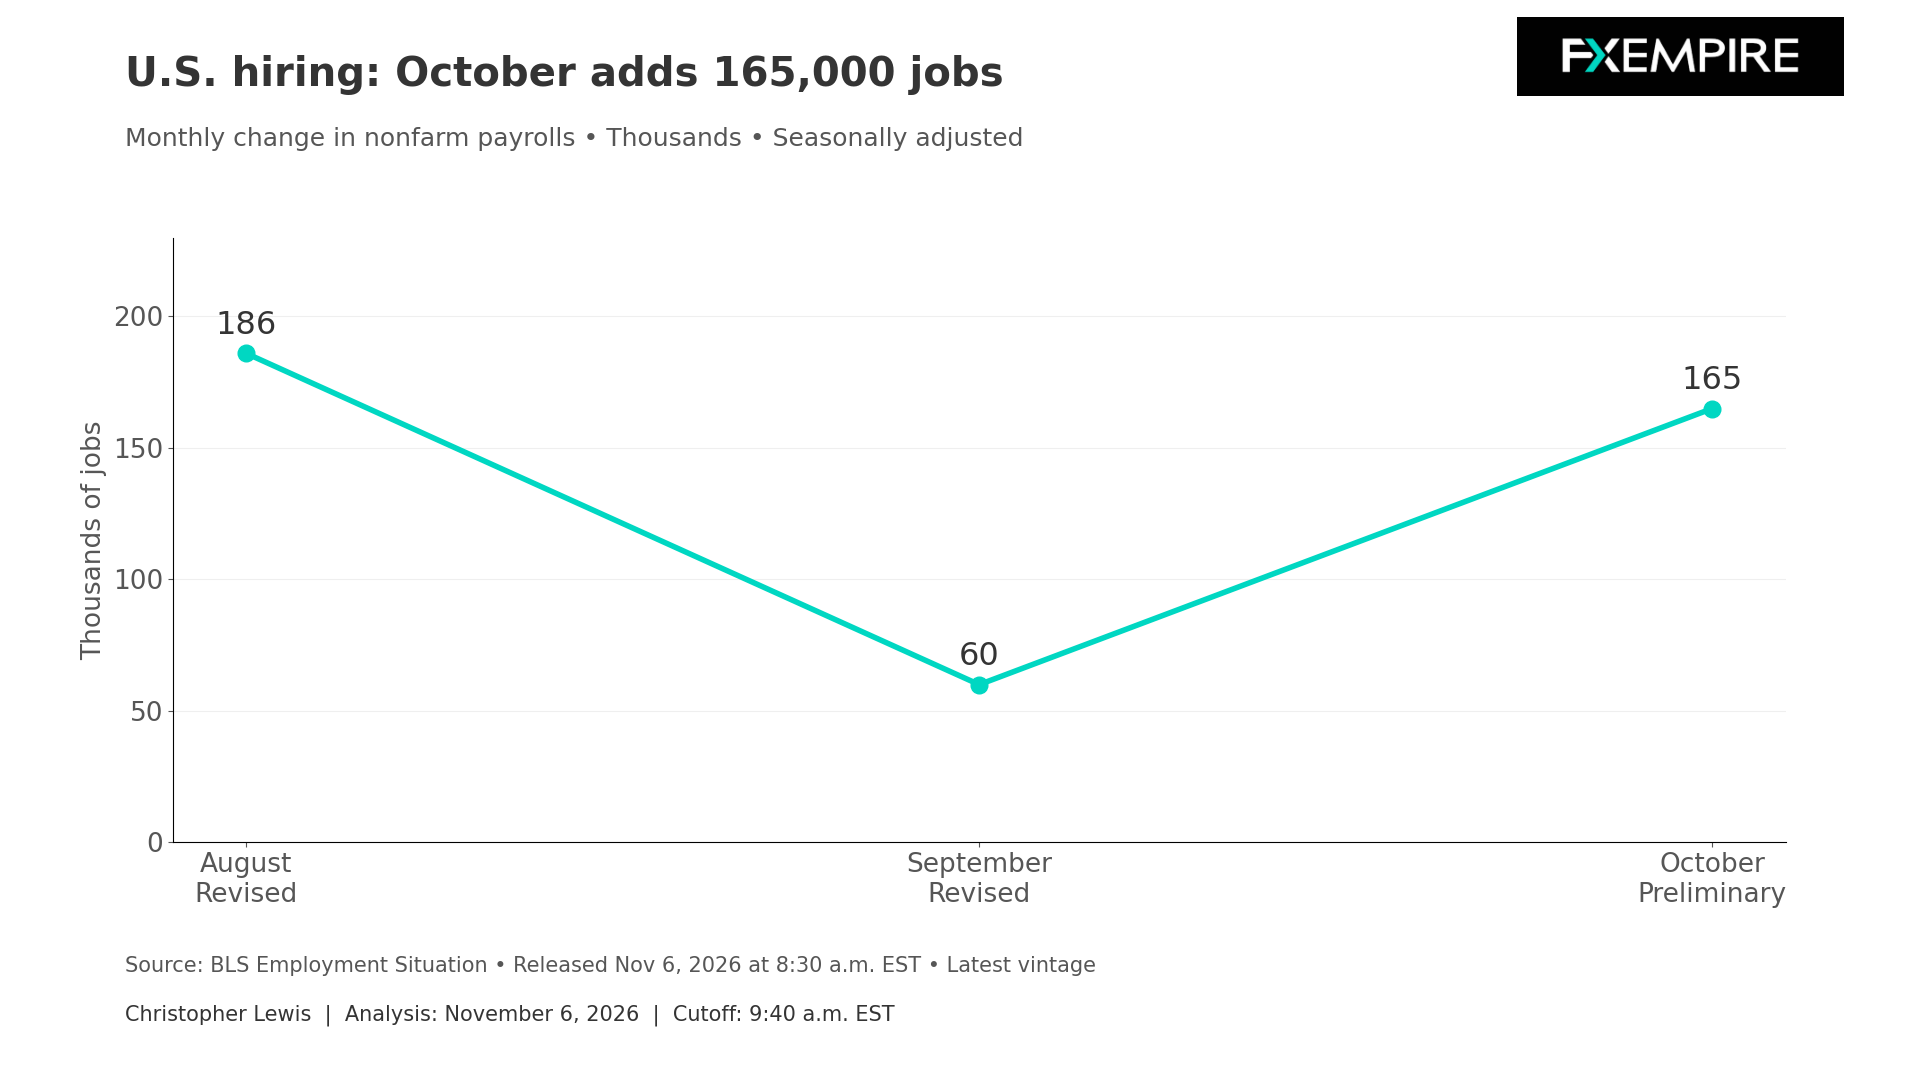
For growth stocks, it can support spending and revenue expectations, but it can also limit the argument for easier monetary policy. So, kind of a push-pull here. Quite frankly, when I look at the NASDAQ 100, yesterday was overdone, and I suspect that Friday is going to be more of a day of stabilization. But I have started to put fresh small longs to work.
When we look at the longer-term chart, yes, it has been a significant drop-off, but we’ve seen this movie before. Quite frankly, as just a handful of companies move the NASDAQ 100 these days for any significant amount of time, I choose not to short it.
Platinum
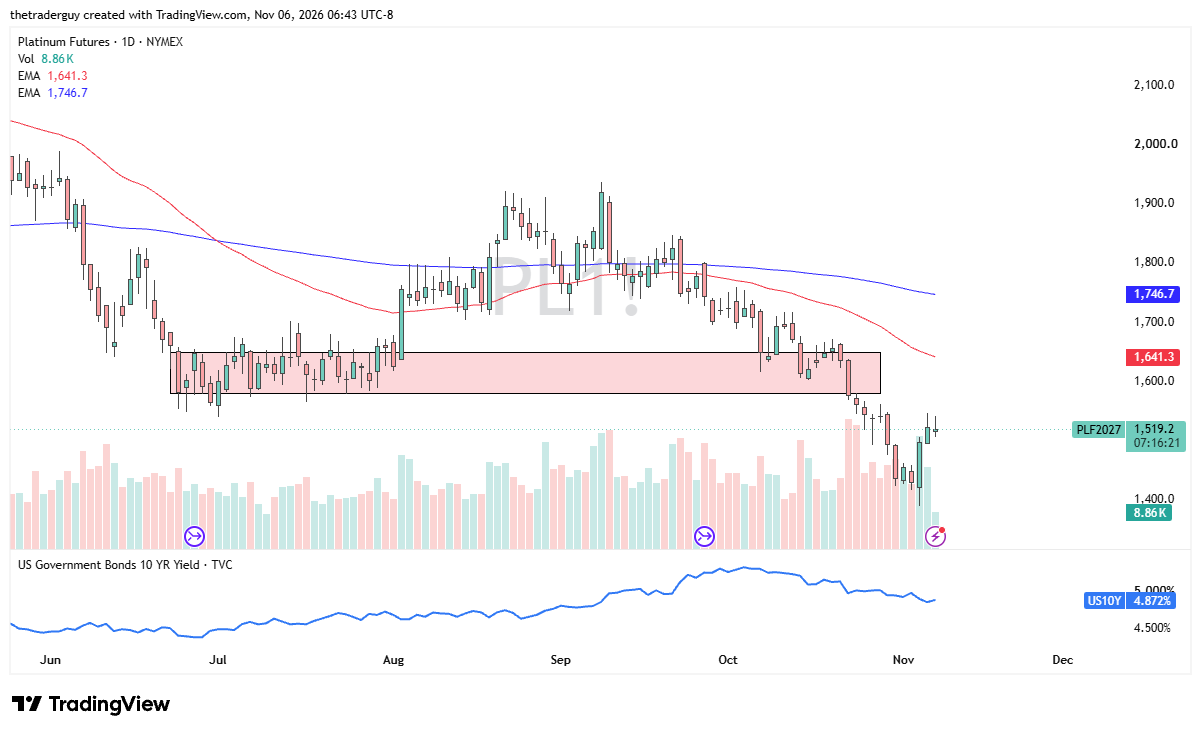
Platinum is looking a little bit hesitant to continue going higher. That does make a certain amount of sense because the jobs number is going to favor some bullish industrial activity, and platinum, of course, is an industrial metal. It’s not just a precious metal.
So, it’s worth noting that manufacturing employment increased by 19,000, including gains in machinery and primary metals, according to the BLS. That is a potential tailwind for platinum, but we’ll just have to wait and see. This doesn’t necessarily mean that it’s automotive catalyst demand or platinum consumption in general.
There is the cost of holding a non-yielding asset. Remember, those real yields continue to be strong in America, and I think that is our story here. While platinum may fare better than some of the others, I still think it’s going to face a significant headwind right around $1,550.
Quite frankly, I don’t have any qualms whatsoever about shorting signs of exhaustion and will probably be doing that fairly soon. I don’t look for a collapse. I just think we’re in a downtrend.
USD/CHF
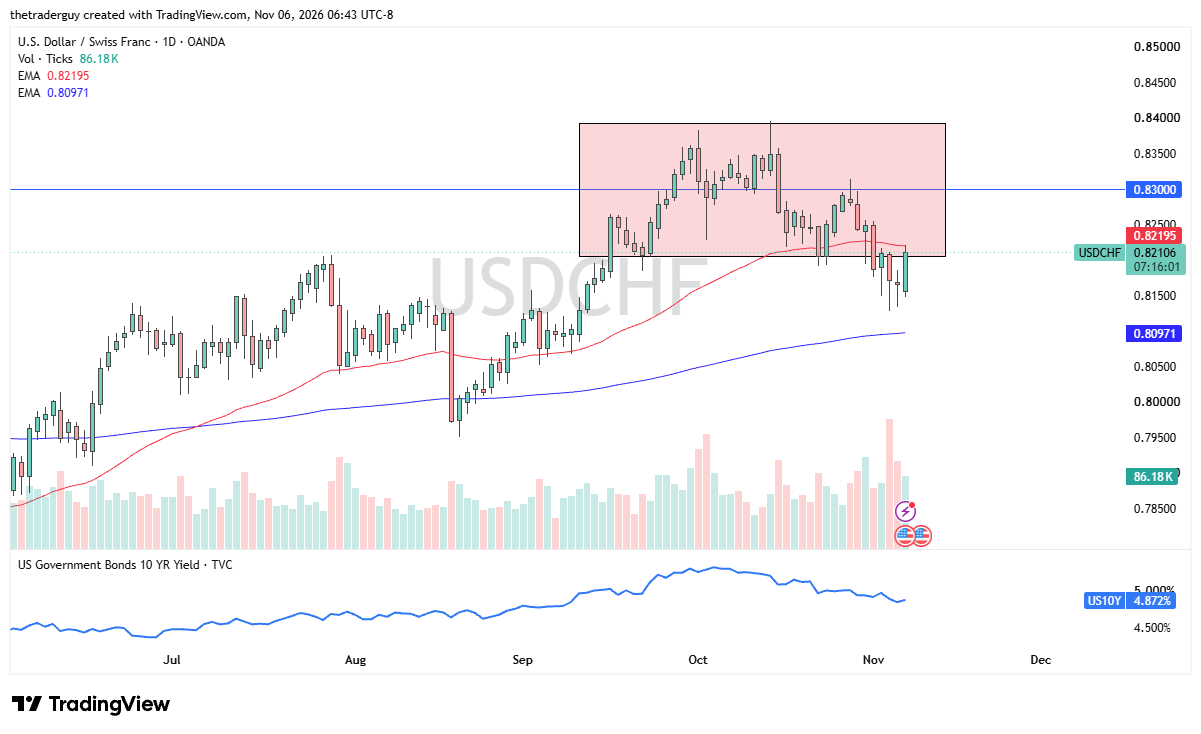
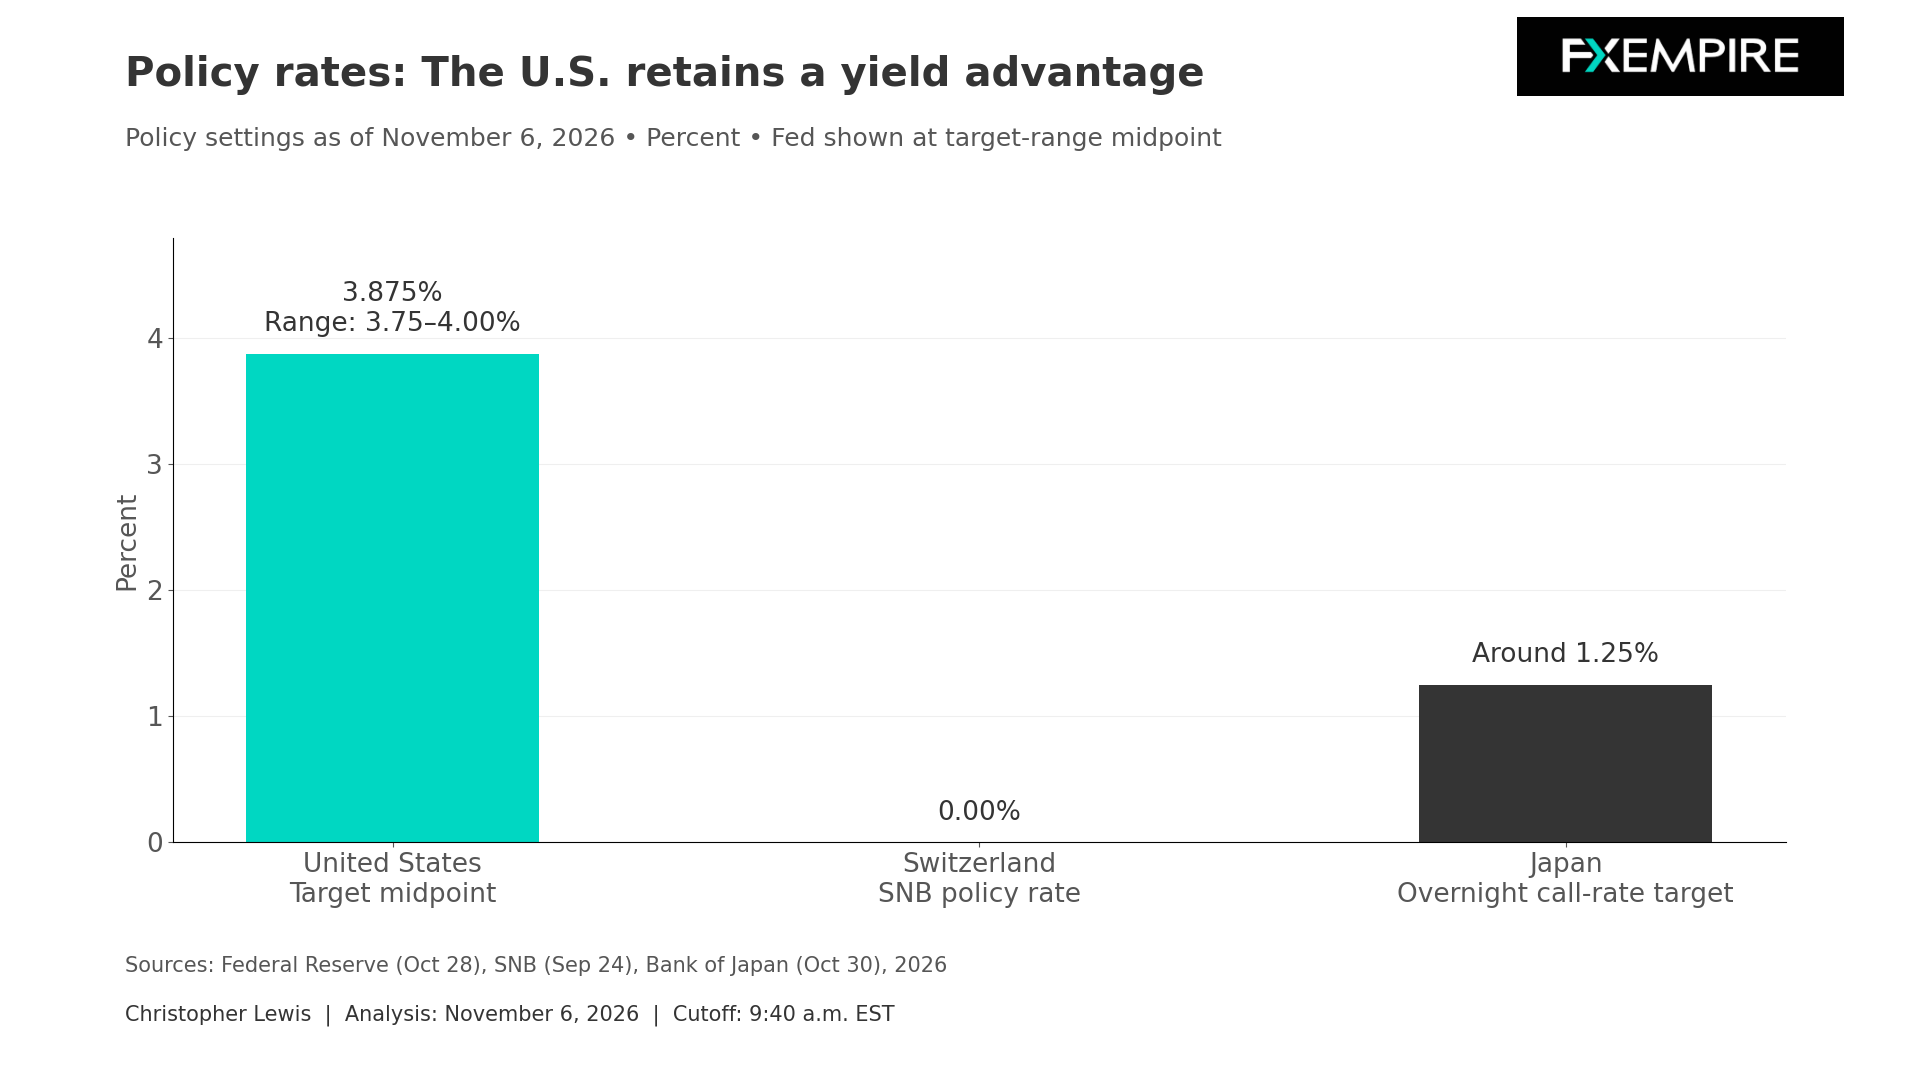
The U.S. dollar has jumped against the Swiss franc, as we would expect, after that jobs report because of the interest rate differential and the fact that the Swiss National Bank is nowhere near tightening. With that in mind, we touched the 50-day EMA. The question is, can we break above there?
I think we do eventually, and if we look at the candlesticks over the last couple of days, they have suggested that there are buyers underneath looking to stabilize this pair. So, we’ll see how this plays out, but clearly, this is a market that I think will continue to play the carry trade.
The SNB September forecast put average inflation in Switzerland at 0.7% this year and 0.8% next year, so it’s not high. Therefore, I think the Swiss will retain their zero policy. The Fed, on the other hand, with those job additions, is probably all but locked in for another rate hike in December.
USD/JPY
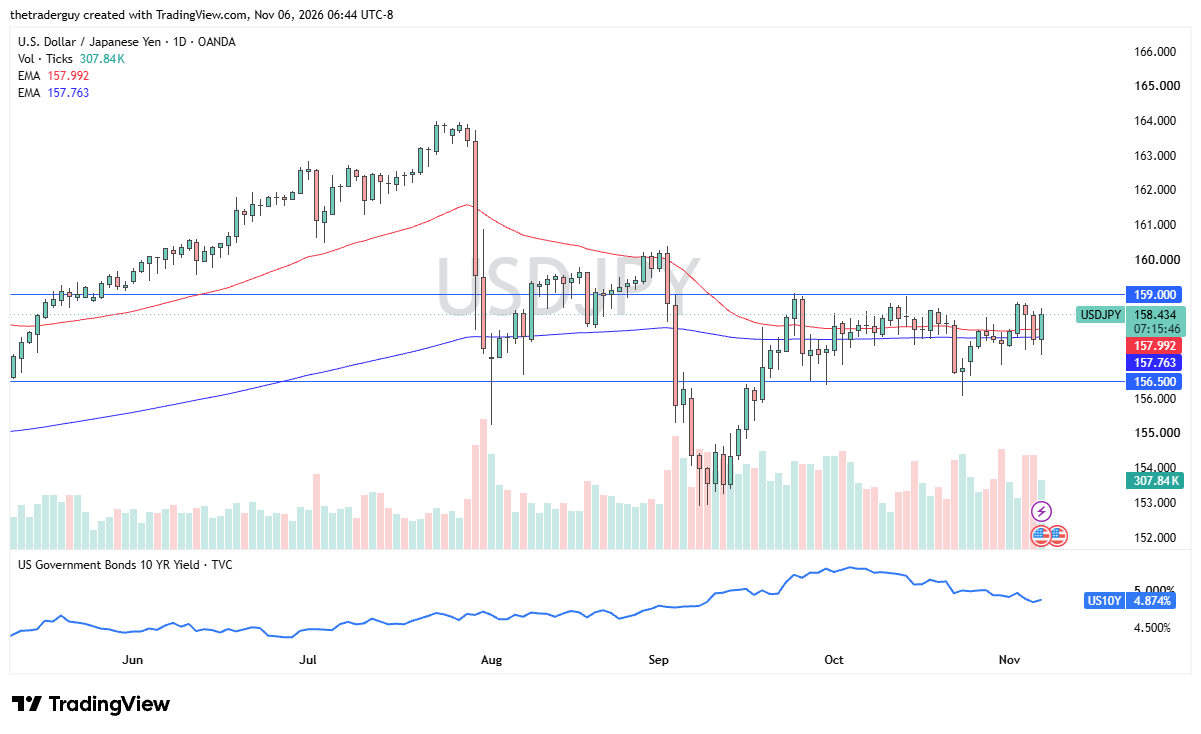
Finally, the dollar against the yen. This is a pair that has been range-bound for a moment now, and it still looks like the ¥159 level is worth watching. If we can break that, I become a bit more bullish. Right now, though, this is a range-bound market.
I like buying short-term dips. We do get paid at the end of every day, but we have to be extraordinarily patient. This is a market that is trying to sort out whether or not the Japanese and the Americans are both going to hike next. If they do, then it’s status quo, and I think that’s what we’re seeing here. I like buying short-term dips for short-term trades only.