


Rally Momentum Meets Resistance
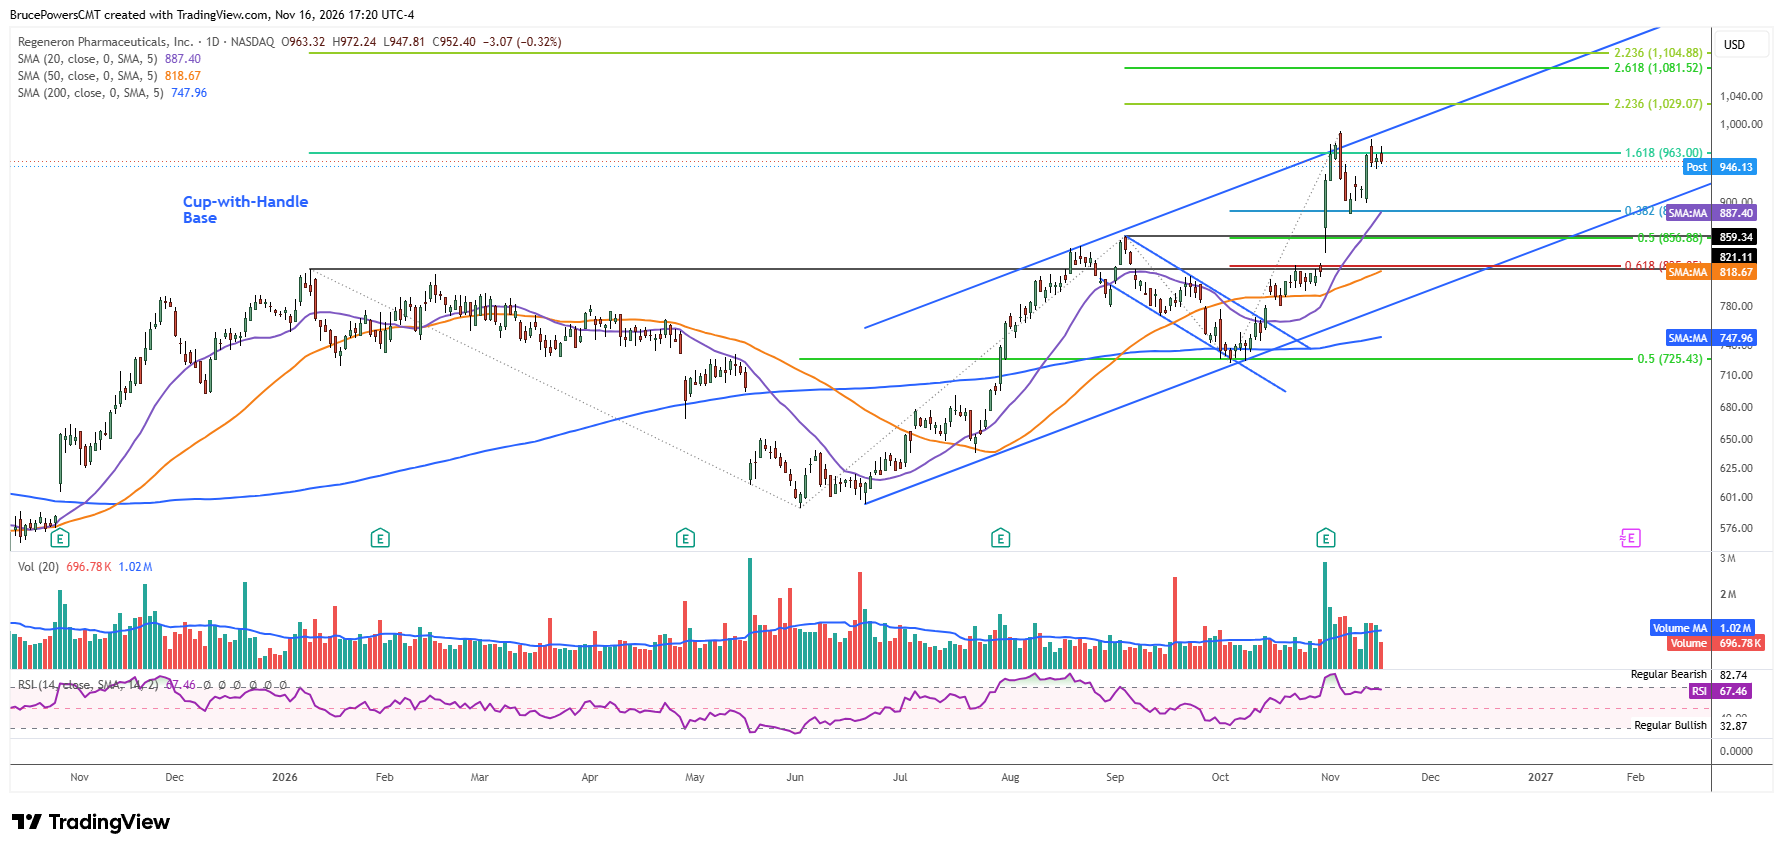
Regeneron Pharmaceuticals, Inc. (REGN) is a U.S. biotechnology company in the relatively strong healthcare sector. It reported Q3 2026 earnings before the market open on October 30, and the stock advanced sharply to a new high of $991.73 two weeks ago. By that point, REGN had gained $269.71 (or 37.4%) from the recent swing low of $722.02, established in early October. So far, resistance has held back further upside, and there is now the possibility of a lower swing high being established on the daily chart and a lower weekly high as well. However, the significance of this potential weakening becomes clearer when viewed from a larger perspective.
Bullish Structure Faces a Technical Test
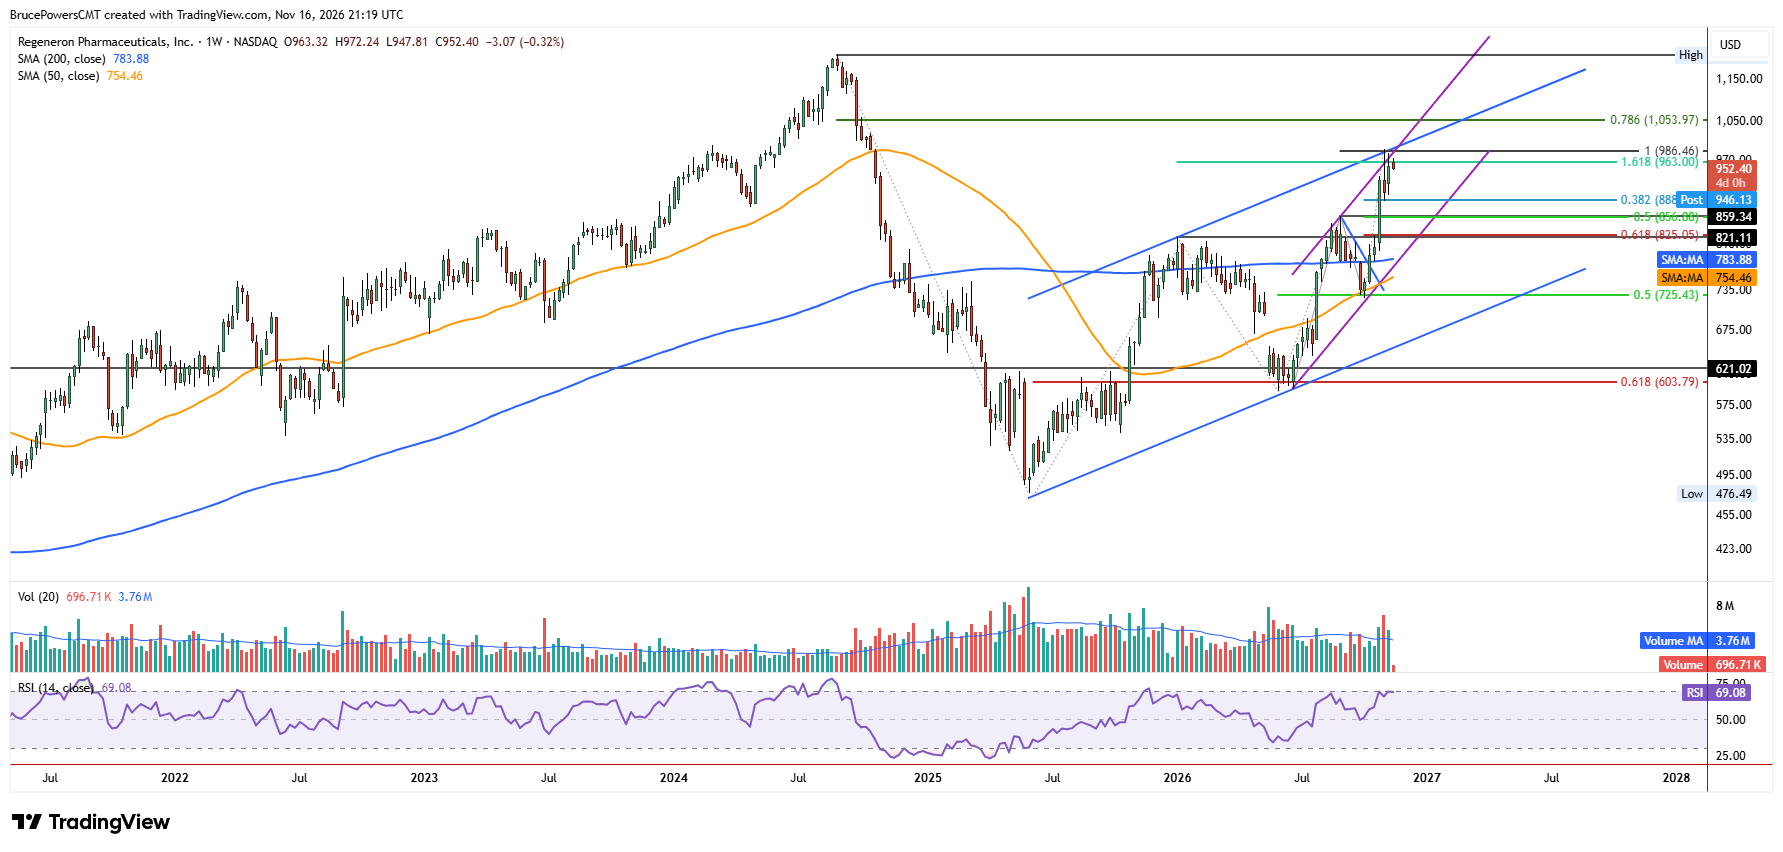
Although REGN has been in a strong bullish trend, it may have become overextended and be due for a correction of some degree. But given the recent successful breakout above the handle portion of a cup-with-handle basing pattern following earnings, the intermediate- and long-term trends should remain intact. After a correction, REGN is technically positioned to eventually find support and again attract buyers while maintaining the bullish trend structure. Regardless, the short-term bearish scenario would begin to fail if the $991.73 high is recovered and buyers retain control.
As seen on the weekly chart, there are several indicators that reinforce resistance near the $991.73 high, starting with a bearish shooting star candlestick pattern that completed. So far, the pattern has not confirmed with a decline below that week’s low of $904.35. Instead, an inside week was generated last week, with a higher weekly low of $898.29 and a lower high of $981.55, marking weekly support and resistance, respectively.
Fibonacci Support Defines Correction Risk
If the shooting star is triggered to the downside, the top of the handle at $859.34 and the top of the cup base at $821.11 become potential downside targets based on the pattern structure. Each area is reinforced by a Fibonacci level, starting with the weekly low of $887.04, which aligns with the 38.2% Fibonacci retracement of the prior advance. In addition, the $821.11 area is reinforced by the rising 50-day moving average, now near $818.63, as well as the 61.8% Fibonacci retracement level.
If you’d like to know more about technical analysis and how traders use it, please visit our educational area.