


Earnings Optimism Meets Bearish Technical Signals
A larger bearish pattern is unfolding in the stock of Rocket Lab Corporation (RKLB). The company operates in the space sector providing launch services and space systems solutions. It reported Q3 2026 earnings on Monday, November 9, after the market close. Although shares initially rebounded on Tuesday, recent bearish signal, including the breakdown from a head-and-shoulders top pattern, suggest that buyer enthusiasm may be limited. On Tuesday, the stock hit a high of $63.77 and closed near the high at $62.71.
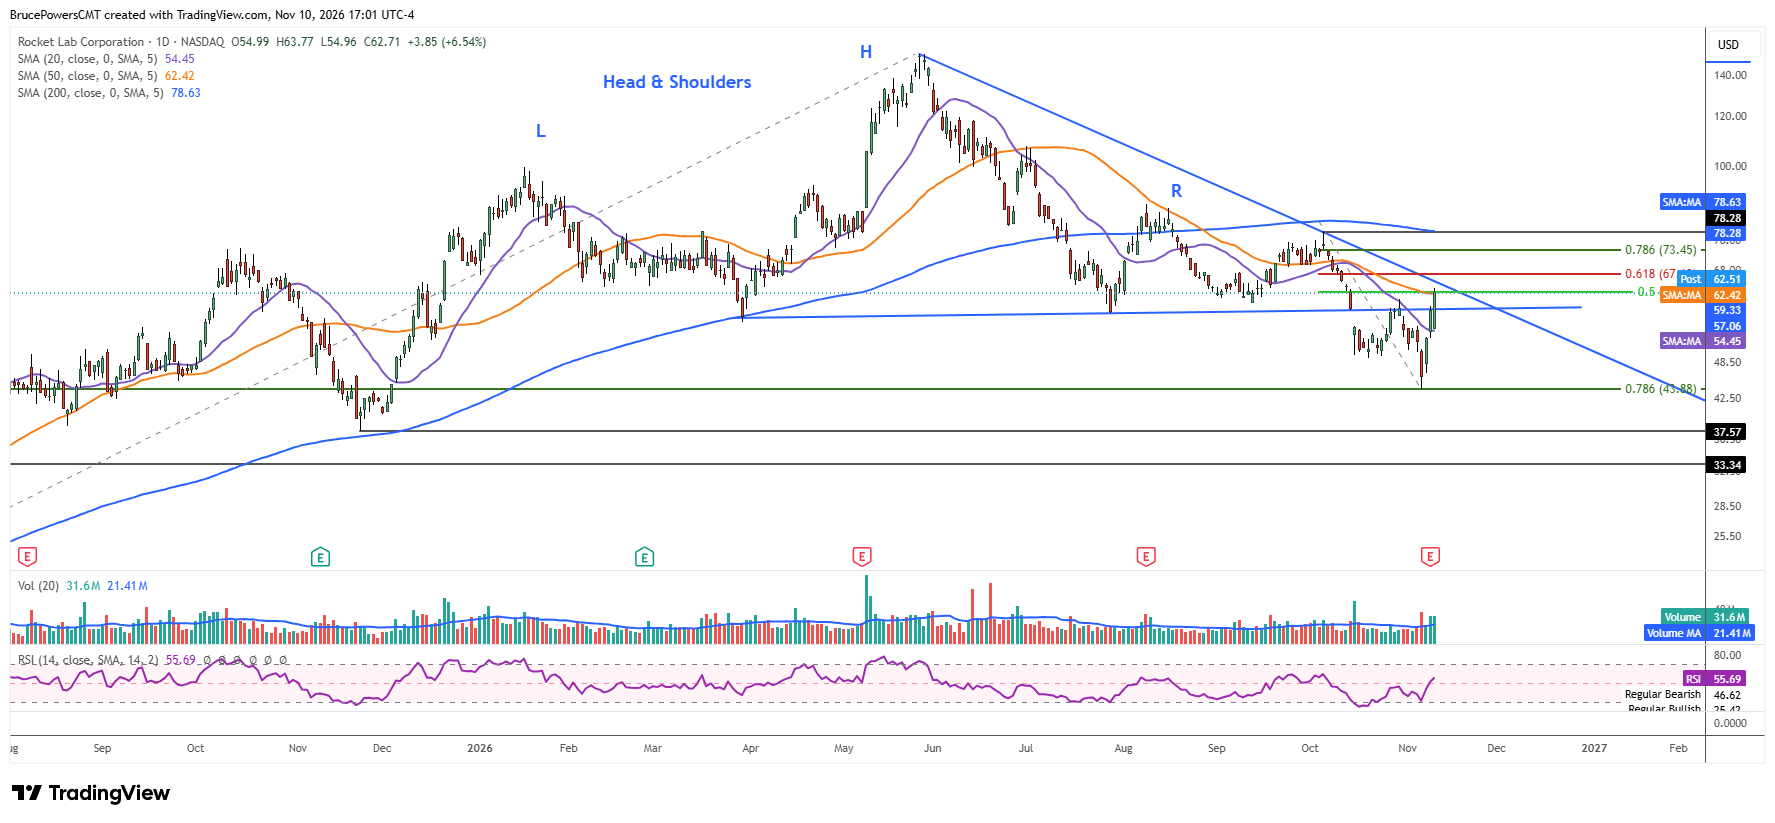
Head-and-Shoulders Breakdown Defines Resistance
The head-and-shoulders pattern triggered with a break below the neckline on October 15, providing another bearish reversal signal for the prior advance. That resulted in a low of $43.89 last week and the completion of a 78.6% Fibonacci retracement at $43.88. The week ended with a bullish hammer candlestick pattern that triggered to the upside during Monday’s session.
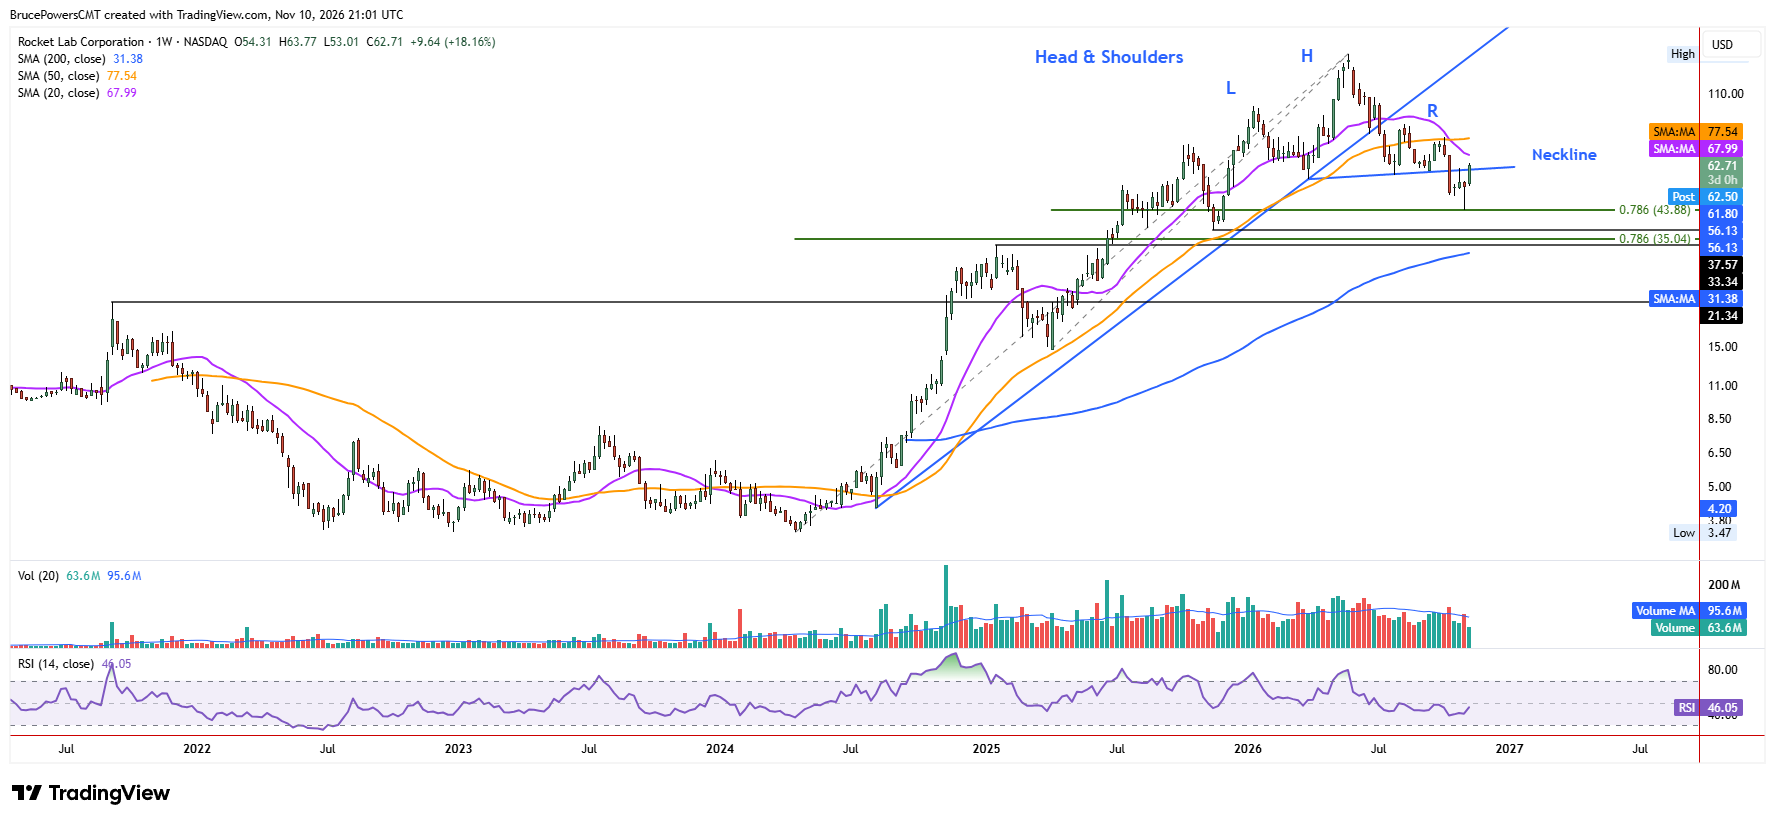
Recovery Faces Significant Overhead Resistance
Bearish implications from the breakdown of the head-and-shoulders pattern were reinforced by the earlier loss of dynamic support at the 200-day moving average in July. Current strength in RKLB is the first pullback to test resistance following the pattern breakdown. Therefore, the larger, more influential topping pattern is anticipated to eventually hit resistance that stops the ascent and turns RKLB back down. Key resistance is at the October lower swing high of $78.28. For now, a bearish outlook remains unless that high can be recovered. There is also a lower weekly high at $68.07 that can be watched for signs of resistance.
Breakdown Confirmation Opens Lower Price Targets
If the bearish head-and-shoulders breakdown continues to unfold, eventually confirmed by a decline below last week’s low of $43.89, the next lower target can be defined by a potential support range from $37.57 to $33.34, consisting of a prior swing low and swing high, respectively. That zone is reinforced by the 78.6% retracement of the full advance that began following the April 2024 low of $3.47.
If you’d like to know more about technical analysis and how traders use it, please visit our educational area.