


Silver opens the Tuesday session with the fundamental picture still split between supportive industrial use and investment conditions that are causing issues. The data most directly relevant to factory activity are not current enough to justify fresh acceleration.
The Federal Reserve’s latest published industrial production report covered September and was released October 16. It showed total industrial production rising 0.7% in September and manufacturing output increasing 0.3%. Primary metals, machinery, and electrical equipment, appliances, and components each rose at least 1%, while motor vehicles and parts fell 3%. This shows some strength in certain segments but weakness in others.
Another G.17 Report Coming Today
That being said, we will be getting the Federal Reserve G.17 report today at 9:15 a.m. The release may update the manufacturing picture, particularly in the electrical equipment and machinery areas. The distinction matters. Investors need to pay close attention to whether or not demand picks up in these sectors. Industrial production measures output, not the quantity of silver purchased or incorporated into the products, so make sure to make that distinction.
Real Rates
Silver’s investment side faces the same real-rate headwind as gold, but its industrial exposure can make the metal’s response a bit less uniform. The latest Treasury observations available were dated Nov. 16. The 5-year real yield stood at 2.68% and the 10-year real yield at 2.92%. Higher real yields raise the opportunity cost of precious metals and can cause problems for investors, thereby driving down demand.
If yields were to ease, monetary headwinds may lessen. If they were to rise further, silver could require stronger physical and industrial demand to absorb selling. The October CPI report showed a 0.4% monthly increase in headline prices and a 0.3% increase in core prices. It did moderate from September, but not enough to change policy.
CFTC CoT Report
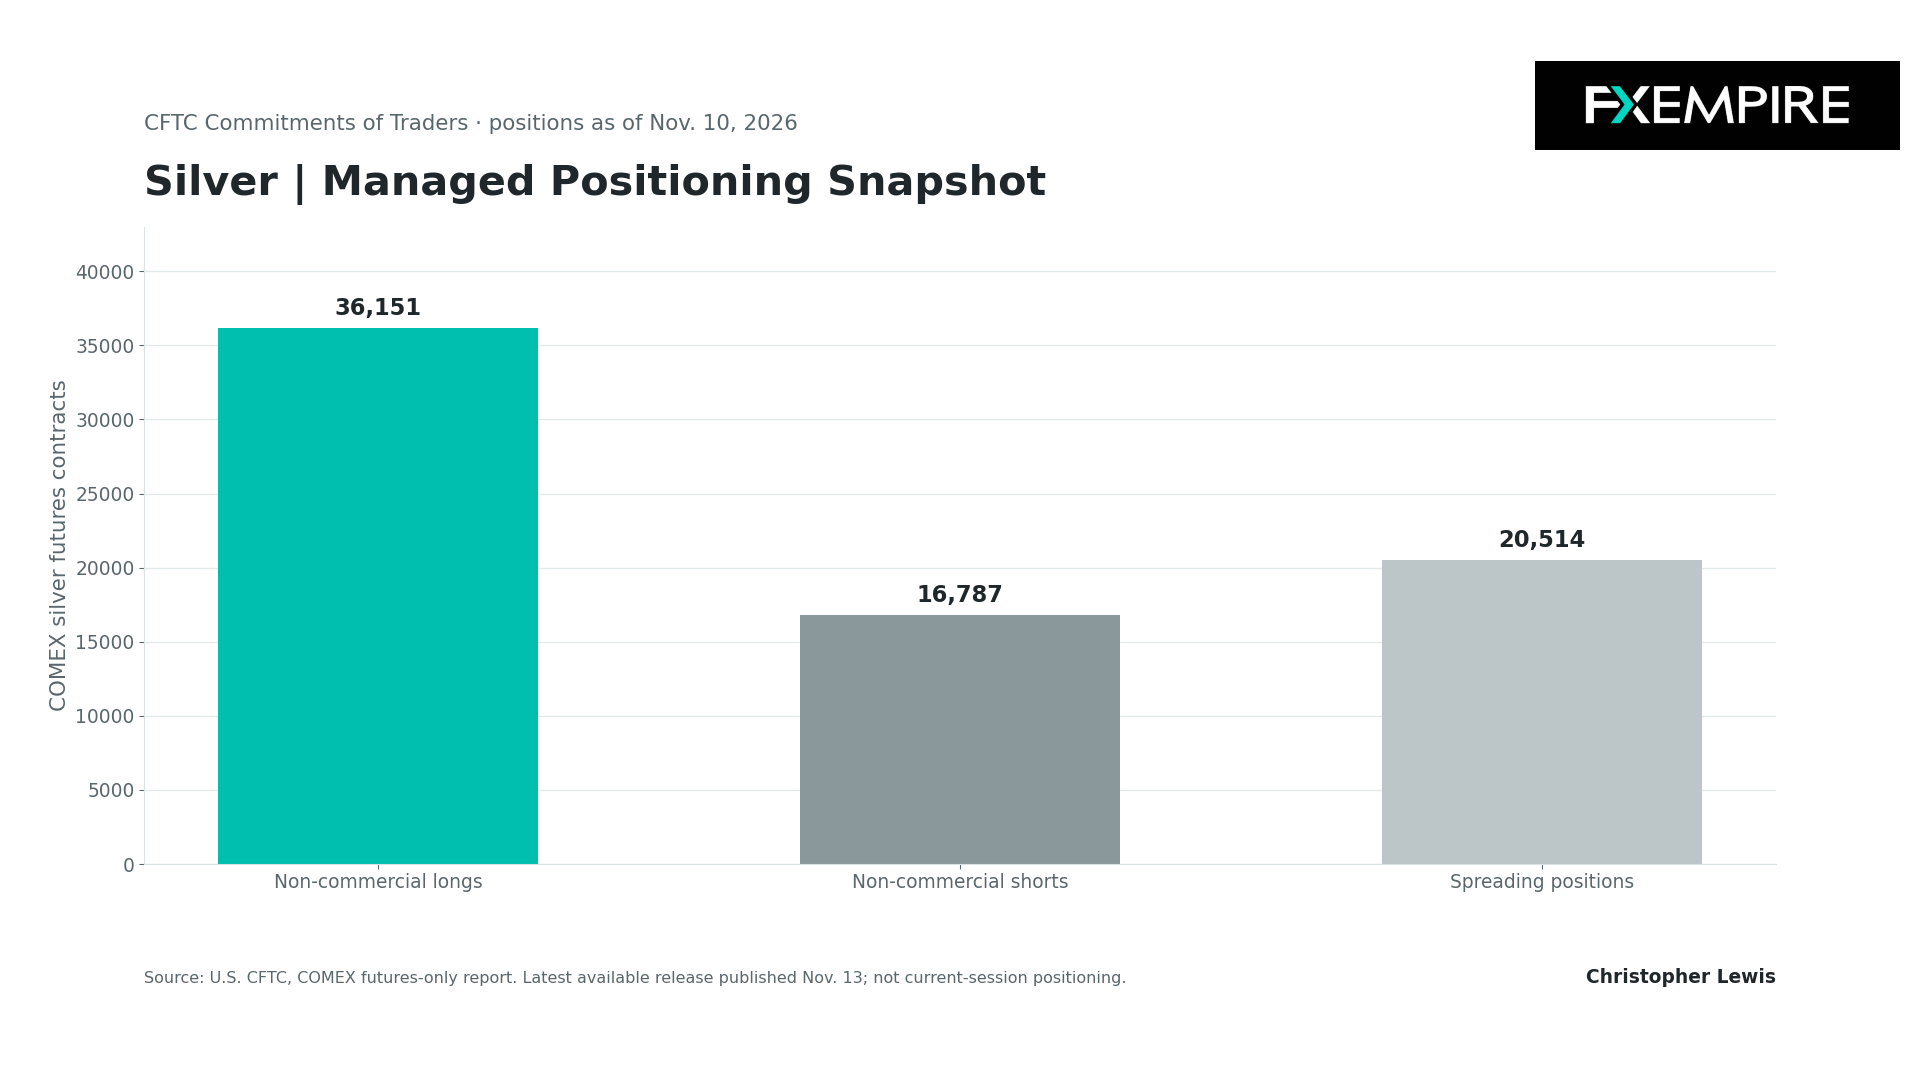
Positioning offers a narrow measure of investor exposure. The latest CFTC Commitments of Traders report was published on Nov. 13 and recorded positions as of Nov. 10. In COMEX silver futures, non-commercial traders held 36,151 long contracts and 16,787 short contracts, a net long of 19,364 contracts. They also held 20,514 spreading positions.
Silver Price Forecast
Every new Silver analysis as it publishes, today's technical signal and key levels, live price — on one page.
See all Silver forecastsCompared with the prior week, non-commercial longs fell by 851 contracts and shorts rose by 1,036, reducing the net long by 1,887. This is a moderation in speculative net exposure, not evidence that all investors have turned bearish. The composition is more informative than a single bullish or bearish label. A net long shows reported speculative longs still exceeded shorts, while the weekly decline suggests some reduction in directional optimism or an increase in hedging.
If a subsequent report shows net longs rebuilding while manufacturing data strengthen, the combination could reinforce the demand-led case. If positioning continues to unwind while real yields stay elevated and factory indicators soften, silver could lose both investment and industrial support.
Technical Analysis for Silver
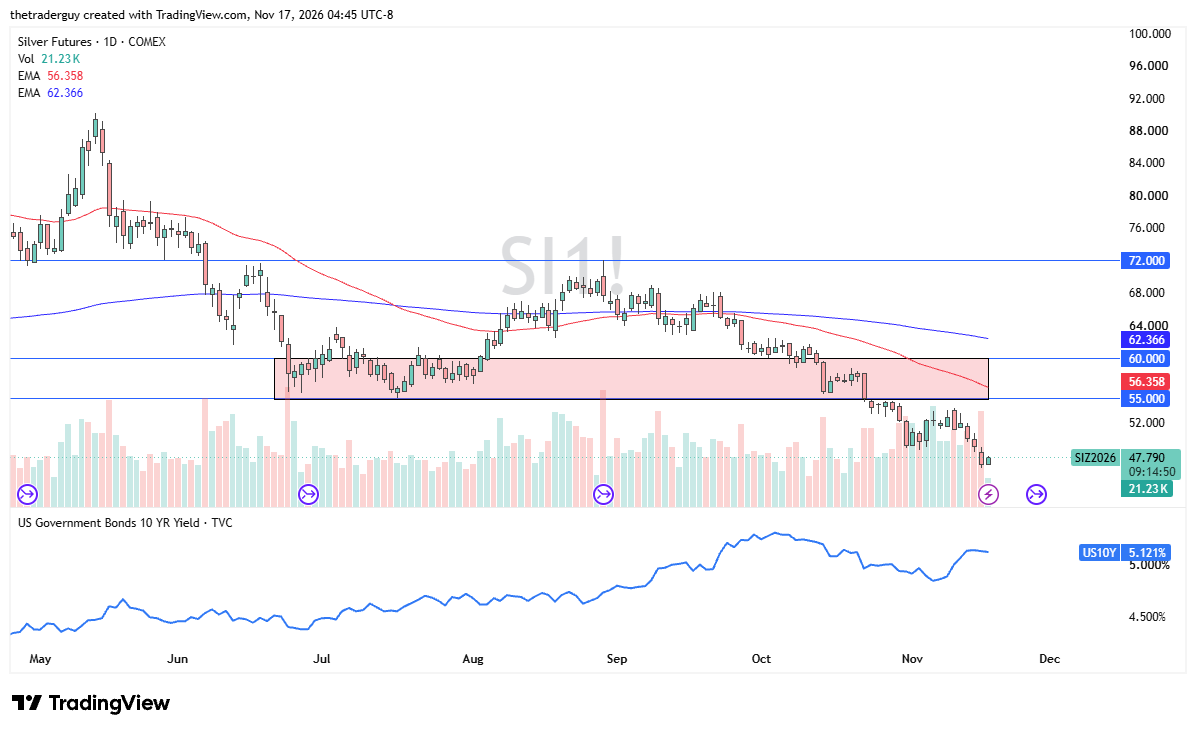
We have seen a little bit of a bounce early in the day, but we have sold off so drastically that it is difficult to get bullish all of a sudden. Rallies at this point in time that show signs of exhaustion still remain selling opportunities, and I’ll be paying special attention to the psychologically important $50 level.
If you’d like to know more about how to trade gold and silver, please visit our educational area.