


Gridlock Bets Send Silver Higher
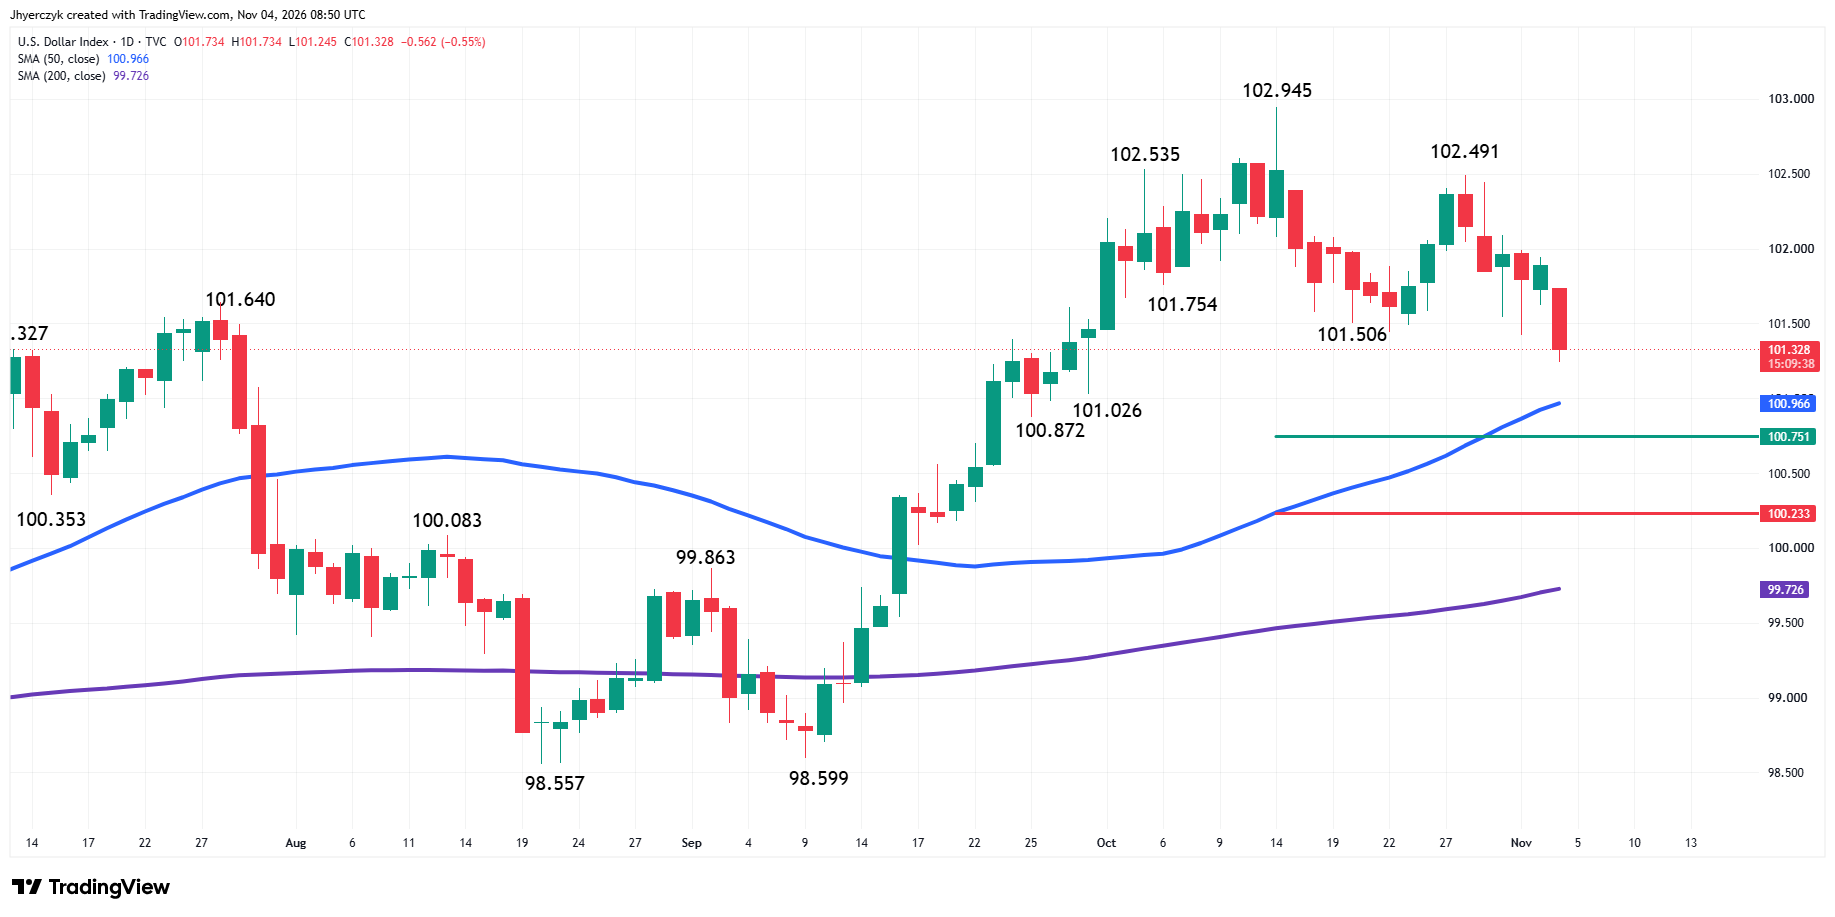
Spot silver and Comex silver futures are sharply higher early Wednesday as yields dropped and the U.S. Dollar fell to a one-month low after U.S. Democrats secured both the Senate and the House after Tuesday’s midterm elections. The price action suggests that traders could be betting on gridlock in the U.S. government because of the potential conflict between the executive and legislative branches.
These are just a few reasons why traders like the long-side of the market at this time.
Political gridlock between the White House and Congress would likely make it harder to pass major spending bills. Less spending and reduced fiscal expansion generally ease pressure on interest rates and borrowing. This could cause bond yields to drop, subsequently weighing on the U.S. Dollar.
Less spending could also push down inflation, which would ease the pressure on the Fed to raise interest rates. And we all have seen what the impact of higher interest rates has had on silver prices.
Essentially, it comes down to lower yields and a softer dollar driving up demand for non-yielding dollar-denominated silver.
Daily Spot Silver (XAGUSD) Technical Analysis
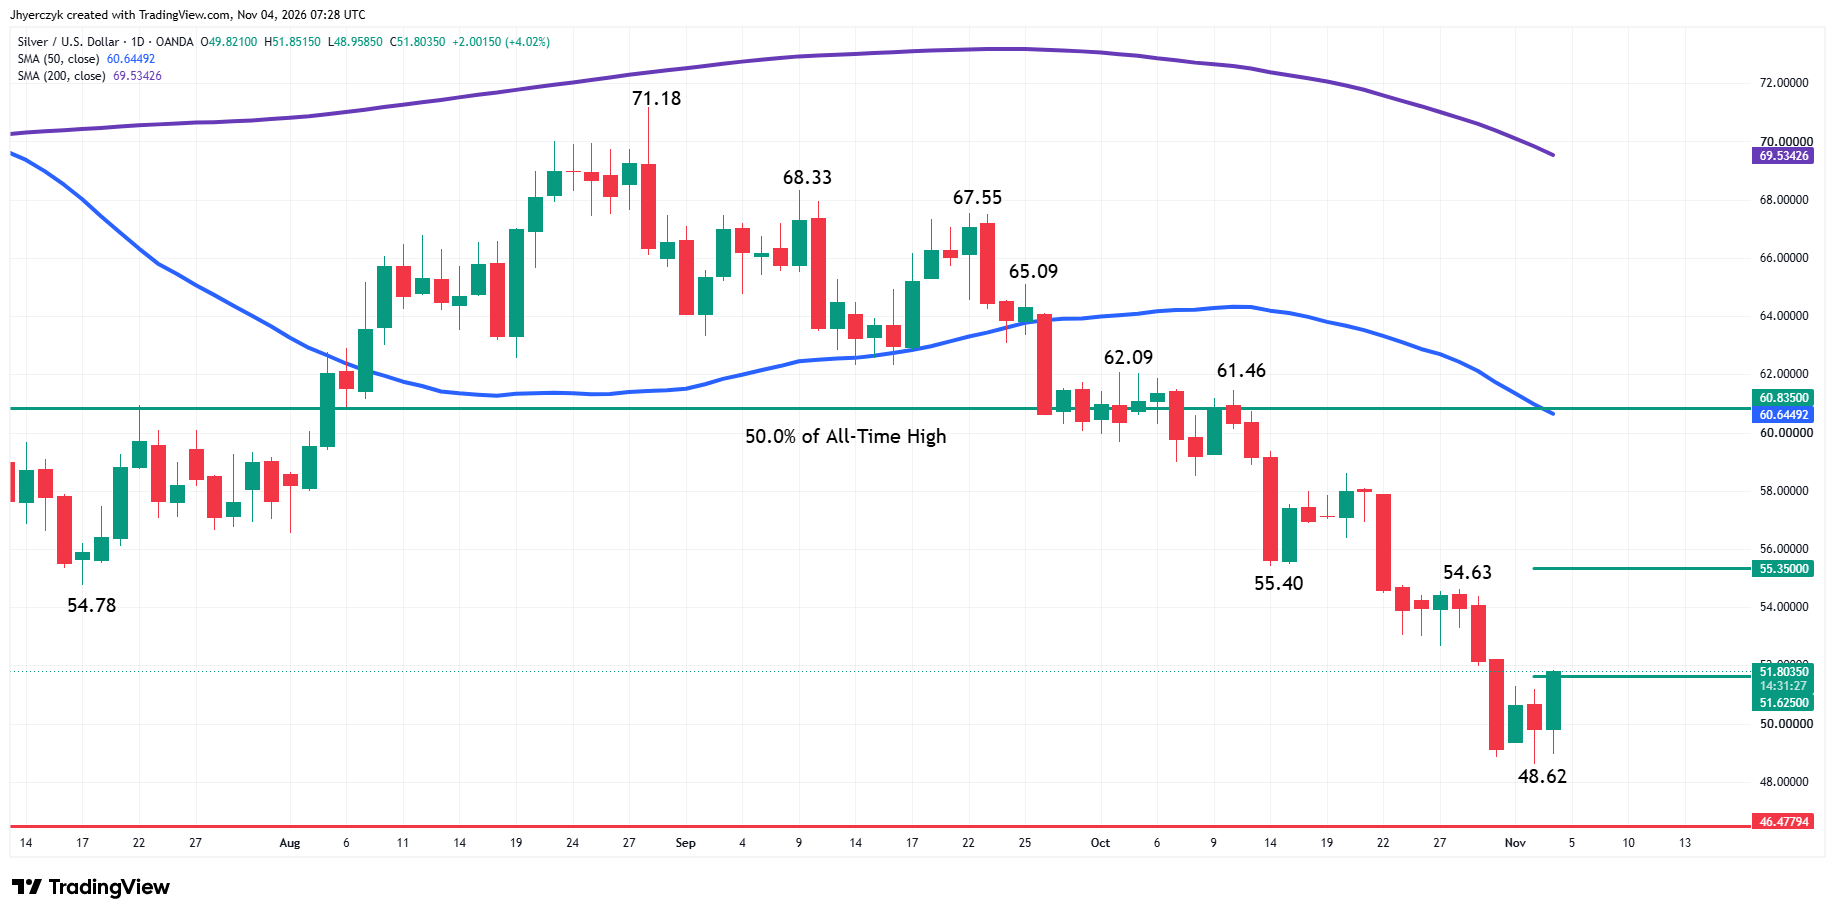
For spot silver, the main trend is down according to the daily swing chart. The main trend will change to up on a trade through the last main top at $54.63. A trade through $48.62 will signal a resumption of the downtrend. The active main range is $62.09 to $48.62. The mid-point of this range is $55.35.
The minor trend is also down, but a new minor bottom has formed at $48.62. The minor range is $54.63 to $48.62. The market is trading above its 50% level at $51.63. Trader reaction to this pivot price is likely to determine the near-term direction.
The all-time high is $121.67. The 50% level of this high is $60.835. A 61.8% retracement from the all-time high is $46.48. The major bottom before the runup to $121.67 is the October 28, 2025, main bottom at $45.55.
Spot silver is also trading on the weak side of the 50-day moving average at $60.64 and the 200-day moving average at $69.53.
Silver Price Forecast
Every new Silver analysis as it publishes, today's technical signal and key levels, live price — on one page.
See all Silver forecastsDaily December Comex Silver Technical Analysis
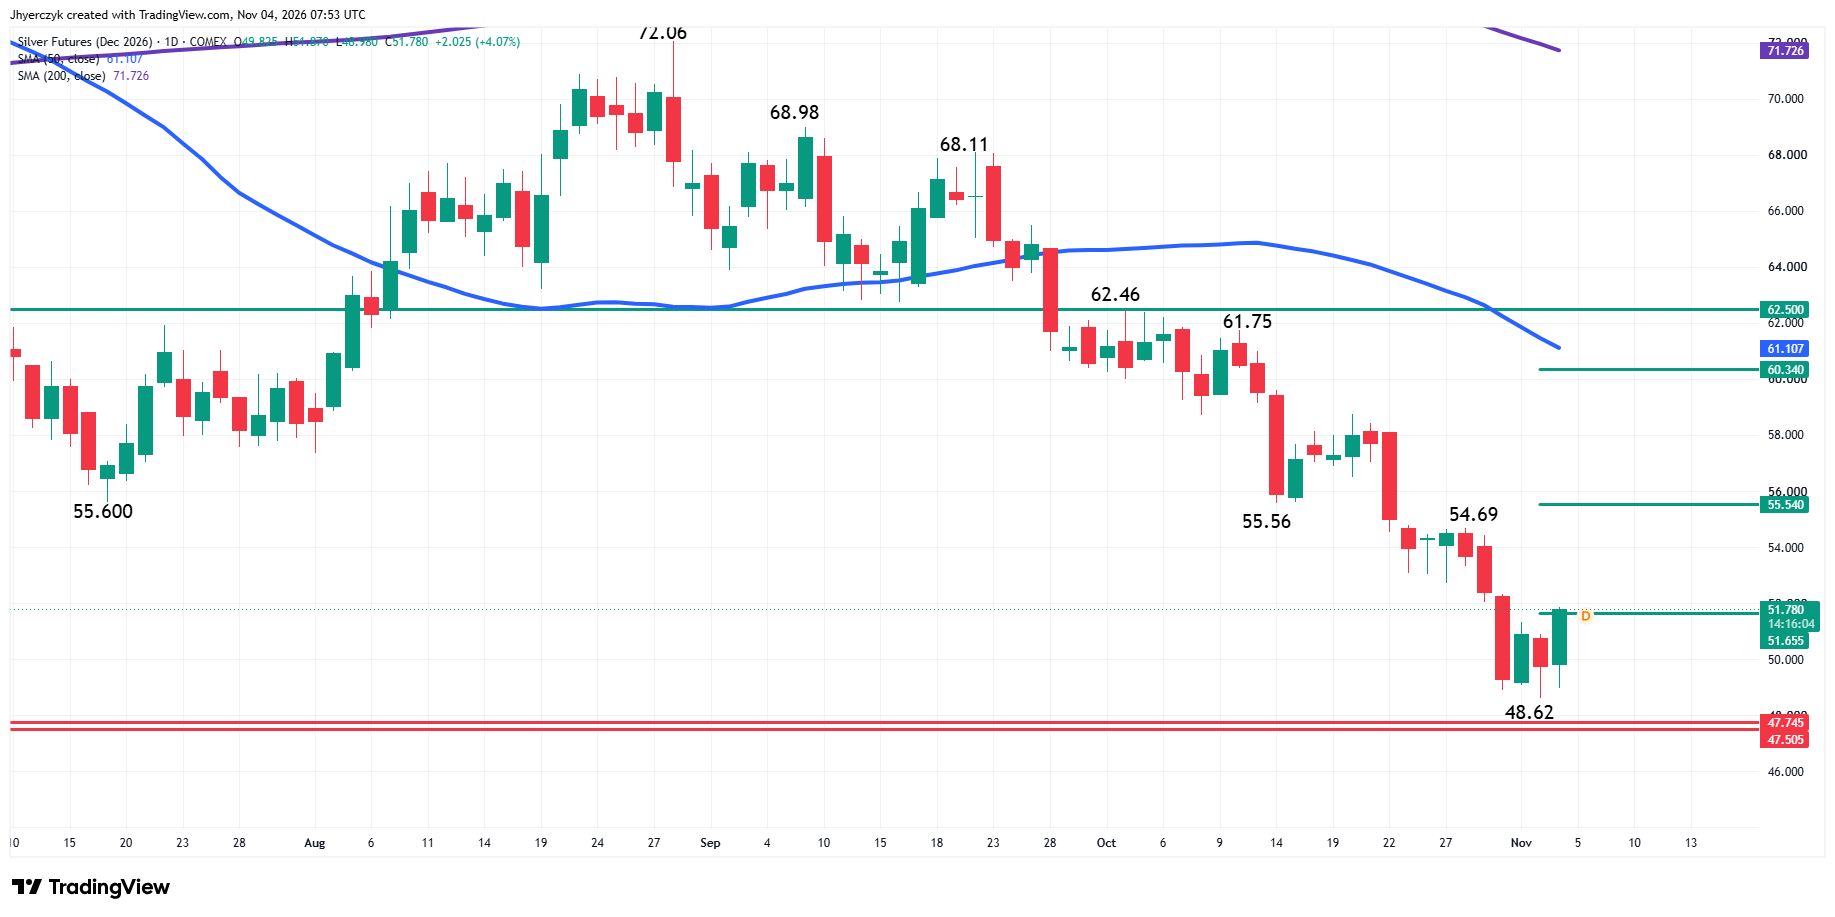
December Comex silver is also in a downtrend. On Tuesday, it was testing the 61.8% retracement from its all-time high at $124.99. This level is $47.75. Directly under this level is the October 28, 2025, main bottom at $47.51. Early Wednesday, it is trading above a minor pivot.
Yesterday’s low at $48.62 has turned into a minor bottom. This price came in just above a support cluster at $47.75 to $47.51. This is a critical area on the chart because there is no major support under it until about the mid-to-lower $30s.
Additionally, the futures contract is getting no support from the main moving averages. The downsloping 50-day and 200-day moving averages at $61.11 and $71.73, respectively, are casting a bearish pall over the market too. The market is also trading on the weak side of the 50% level of the all-time high at $62.50.
Despite this bearish outlook, today’s early price action indicates momentum may be turning to the upside.
Looking at the short-term technical indicators, the main trend is down according to the daily swing chart. A trade through $48.62 will signal a resumption of the downtrend. Taking out the nearest swing top at $54.69 will change the main trend to up.
The minor range is $54.69 to $48.62. Its 50% level at $51.66 is potential resistance and a trigger point for an acceleration to the upside. Traders have already crossed to the strong side of the 50% level. Buyers now have to come in to support the rally at this price. If the market falls back below $51.66, then the move through it will be attributed to a loss of momentum.
The second active short-term range is $62.46 to $48.62. Its 50% level at $55.54 is also potential resistance and a trigger point for an upside surge.
What to Watch
Spot Silver (XAGUSD)
My bias is to the downside because of the prolonged move under the downsloping 50-day moving average and the 200-day moving average. The series of lower tops and lower bottoms are also pressuring the market. Until this swing-chart pattern changes, I’m going to be bearish.
Recovering the minor 50% level at $51.63 will weaken my outlook. Overtaking $54.63 will change the main trend to up, and a breakout over the second trailing pivot at $55.35 could trigger an acceleration to the upside.
For value buyers, the best support area on the daily chart is $46.48 to $45.55.
I don’t think we’ll have a major turnaround in the silver market until traders start actively taking out offers instead of passively bidding. Today’s early buying indicates that aggressive buyers may have changed their approach.
A sustained move over $51.63 will signal the presence of buyers. A failure to hold this level with conviction will indicate the return of sellers. This could lead to an intraday pullback to about $50.24.
December Comex Silver Futures
The daily chart is bearish and so is my bias. My outlook is supported by the main swing chart and the direction of the 50-day and 200-day moving averages.
My outlook will weaken if buyers can sustain a rally over the first pivot at $51.66. The trend will change to up over $54.69, and $55.54 could be the trigger point that launches a rally into $60.34 to $61.75, including the 50-day moving average.
If $47.50 is taken out with conviction, then look out to the downside.
More Information in our Economic Calendar.