


The S&P 500 failed to break above 7,800 and continued to drop last week. This decline was led by the technology stocks as investors are concerned about the heavy investment in AI. However, the energy stocks continue to surge as the escalation of tensions in the Middle East has pushed energy costs higher. But the heavy investment in AI has provided support to the heavy industry. Weak consumption and tighter financial conditions increase uncertainty about the recovery in the S&P 500.
AI Spending and Sector Rotation Shape the S&P 500 Outlook
AI Spending Drives Growth in Heavy Industry
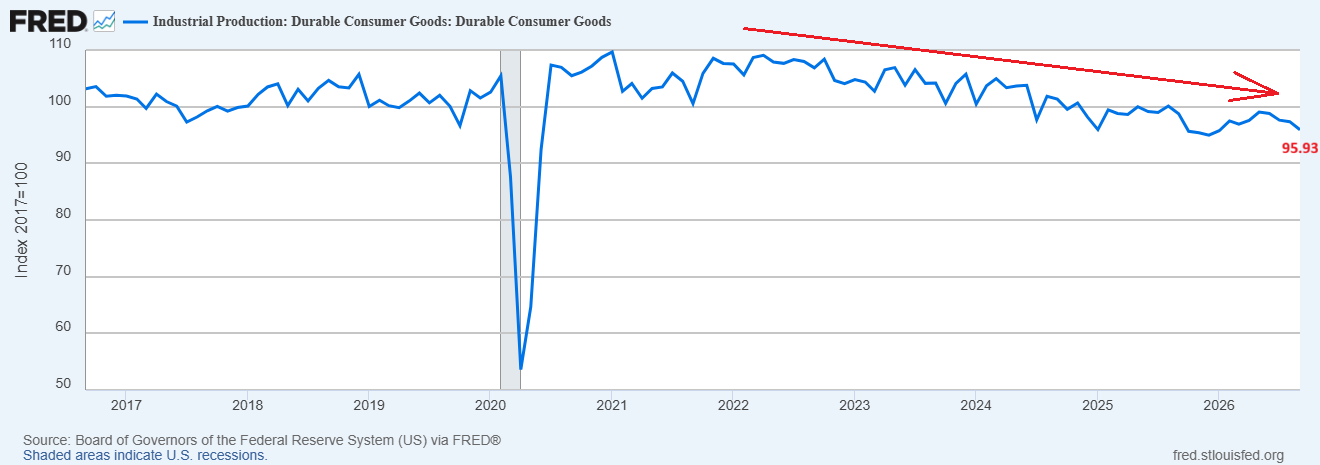
Industrial production of consumer durables is declining as seen in the chart below. The chart shows that industrial production has continued to decline since 2022 and remains in a negative trend.
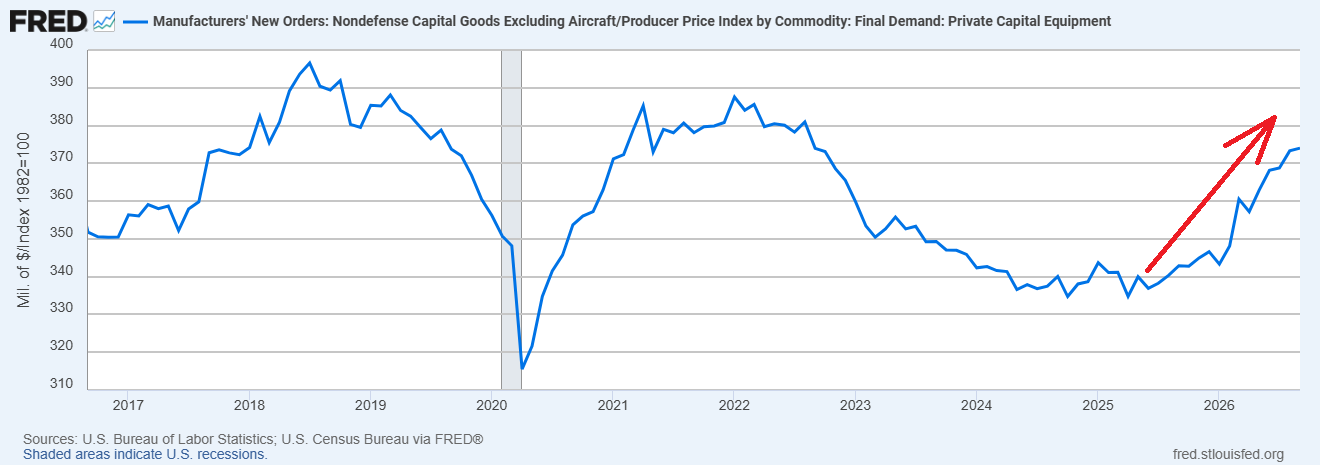
But manufacturers’ new orders for non-defense capital goods have been surging since September 2025. This may be driven by the boom in AI capital spending.
There is a weakness in consumer related freight which is offset by booming heavy industry fueled by AI capex, defense spending and high energy prices. The volumes in food and beverage are down sharply.
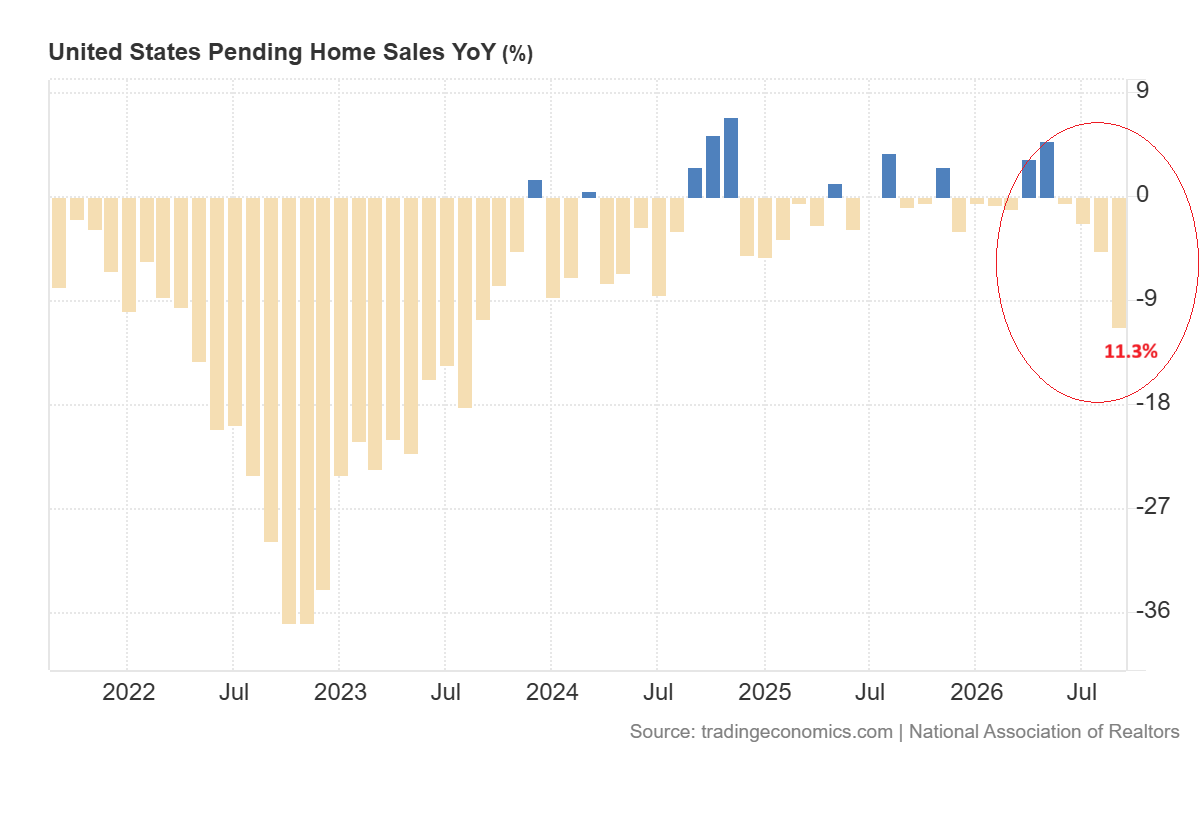
A slowdown in housing sales is a further drag on freight volumes of construction materials, furniture and appliances. The chart below shows that the US pending home sales dropped to 11.3% in September 2026.
But heavy industry is absolutely ripping right now. The massive surge in AI capital spending has not only lifted industrial construction but is also driving major infrastructure buildout to support it. The military defense spending is driven by rising geopolitical tensions after Russia’s invasion of Ukraine in 2022 and has accelerated due to war with Iran.
S&P 500 Price Forecast
Every new S&P 500 analysis as it publishes, today's technical signal and key levels, live price — on one page.
See all S&P 500 forecastsEnergy Stocks Rally as Technology Shares Weaken
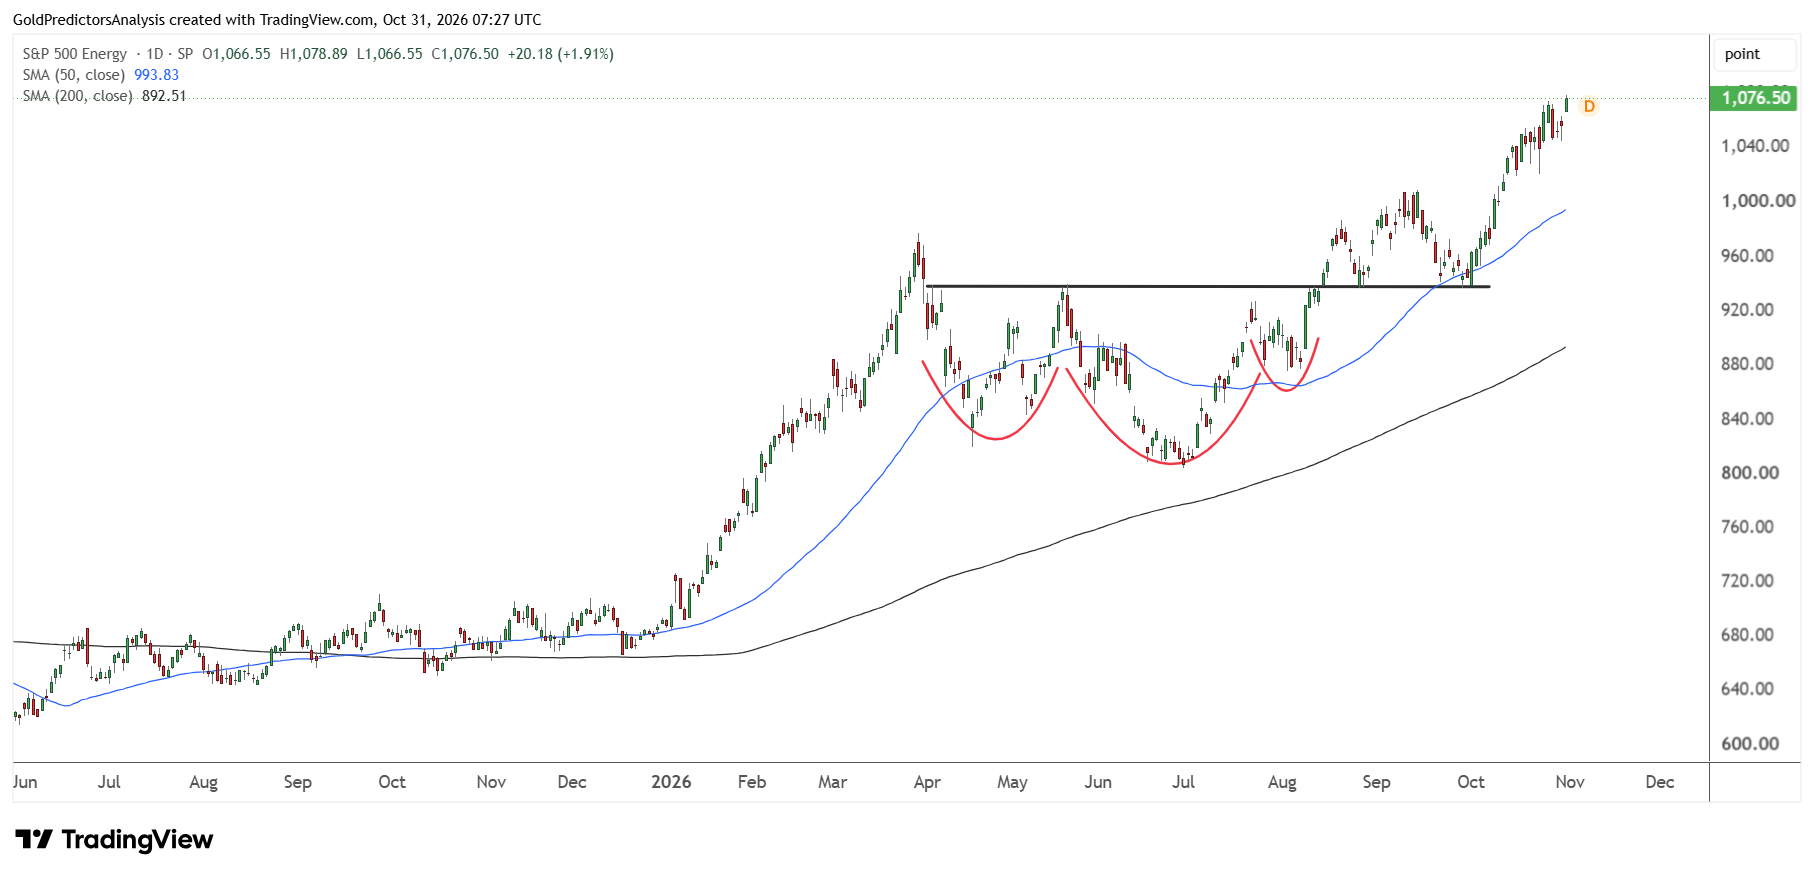
Despite the strong consolidation in the S&P 500 during the past three months, the S&P 500 Energy Index has surged higher. The energy index has formed constructive price action.
This constructive price action is seen in the inverted head and shoulders formation, with the head formed in June 2026 and the shoulders formed in April and August 2026. The index broke above the neckline of this pattern and continued to surge higher above the 1,075 level.
The breakout after the constructive price action suggests that the energy stocks may remain strong in the next few weeks and months.
This surge is also supported by crude oil prices. Brent oil has pushed near the key resistance area of $120. A break above $120 will likely suggest strong rally toward $150. The escalating tensions in the Middle East further support this outlook.
But the strong surge in energy shares is offset by weakness in the technology sector of the S&P 500. The chart below shows that the S&P 500 Information Technology Index has broken below the breakout level of 7,100 and continues to drop lower.
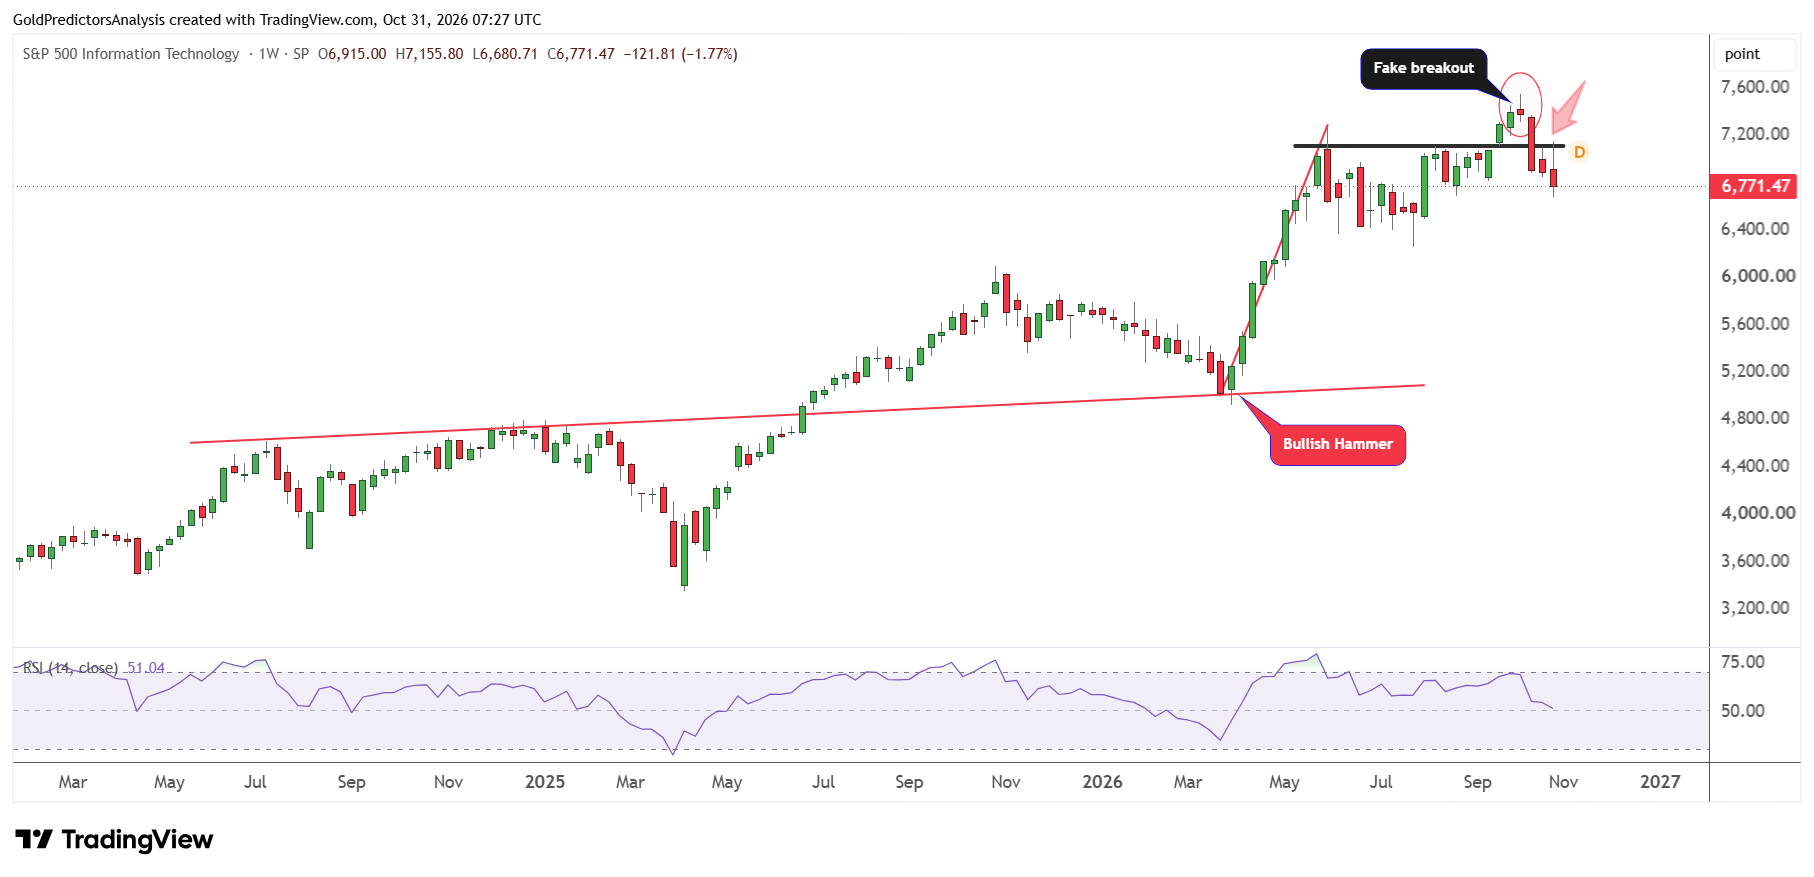
The technology index still remains bullish but is now moving lower in the short term towards key support. The technology index may move towards the 6,000 and 6,500 levels. This means that technology stocks may still face pressure in the short term.
AI Returns and Financial Conditions Keep Investors Cautious
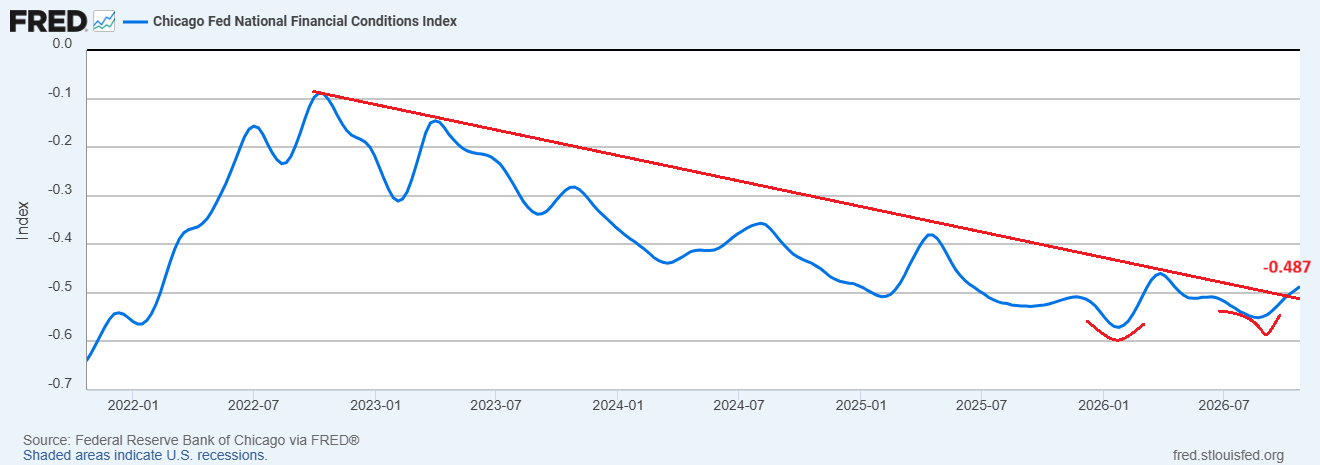
The Chicago Fed Financial Conditions Index has been moving in negative direction since 2023. But the latest rebound from support has pushed the index above the descending trend line.
There has been no new low since January 2026 and the index is now forming bottom after breaking from the descending trend line. This suggests that if the index moves above −0.46, it will suggest tightening of financial conditions.
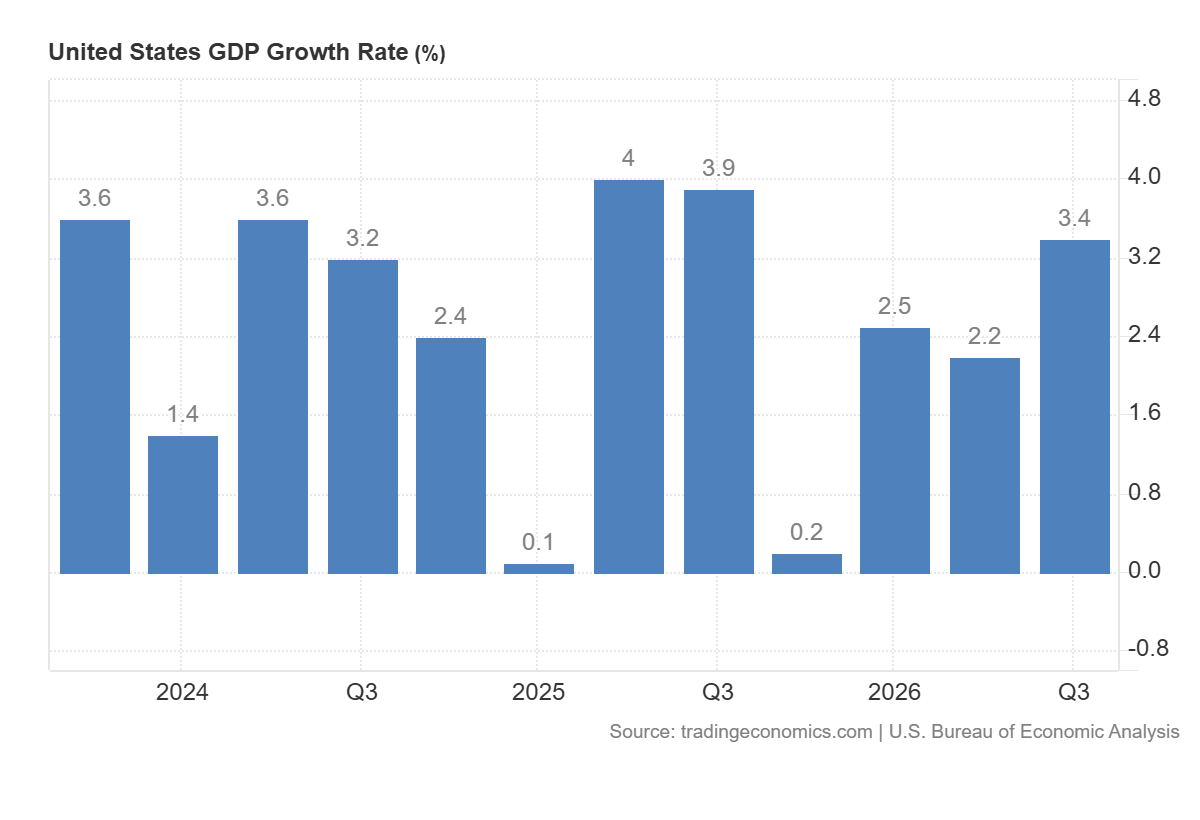
The chart below shows that U.S. GDP expanded at annualized rate of 3.4% in Q3. This is much higher than the 2.2% increase in Q2 and is above expectations of 3.2%. This positive momentum may come from private domestic investment due to heavy investment in AI.
The S&P 500 dropped on Friday and remains under bearish pressure in the short term after failing to break above the 7,800 level. This pressure is coming from technology stocks which have experienced a strong drop as seen by the S&P 500 Information Technology Index. Nvidia Corp (NVDA) dropped by 4.2% and Intel Corp. (INTC) plunged 28.6%.
But around 82% of the S&P 500 companies that have reported their Q3 results have beaten earnings forecasts. This suggests that investors are becoming more concerned about spending on AI, valuations and future cash returns despite strong earnings.
I think that strong earnings need to come with credible returns on AI spending before they can produce lasting recovery in technology shares.
S&P 500 Technical Analysis: 7,500 Support and 7,800 Resistance
From a technical perspective, the S&P 500 has formed strong resistance at the 7,800 level and consolidated below this level during past three months. The index has now broken below the 50-day SMA and is approaching the 7,500 level.
This support level is defined by the descending trend line that stretches from the June 2026 highs. A break below the 7,500 level may push the index towards the 200-day SMA at the 7,300 level.
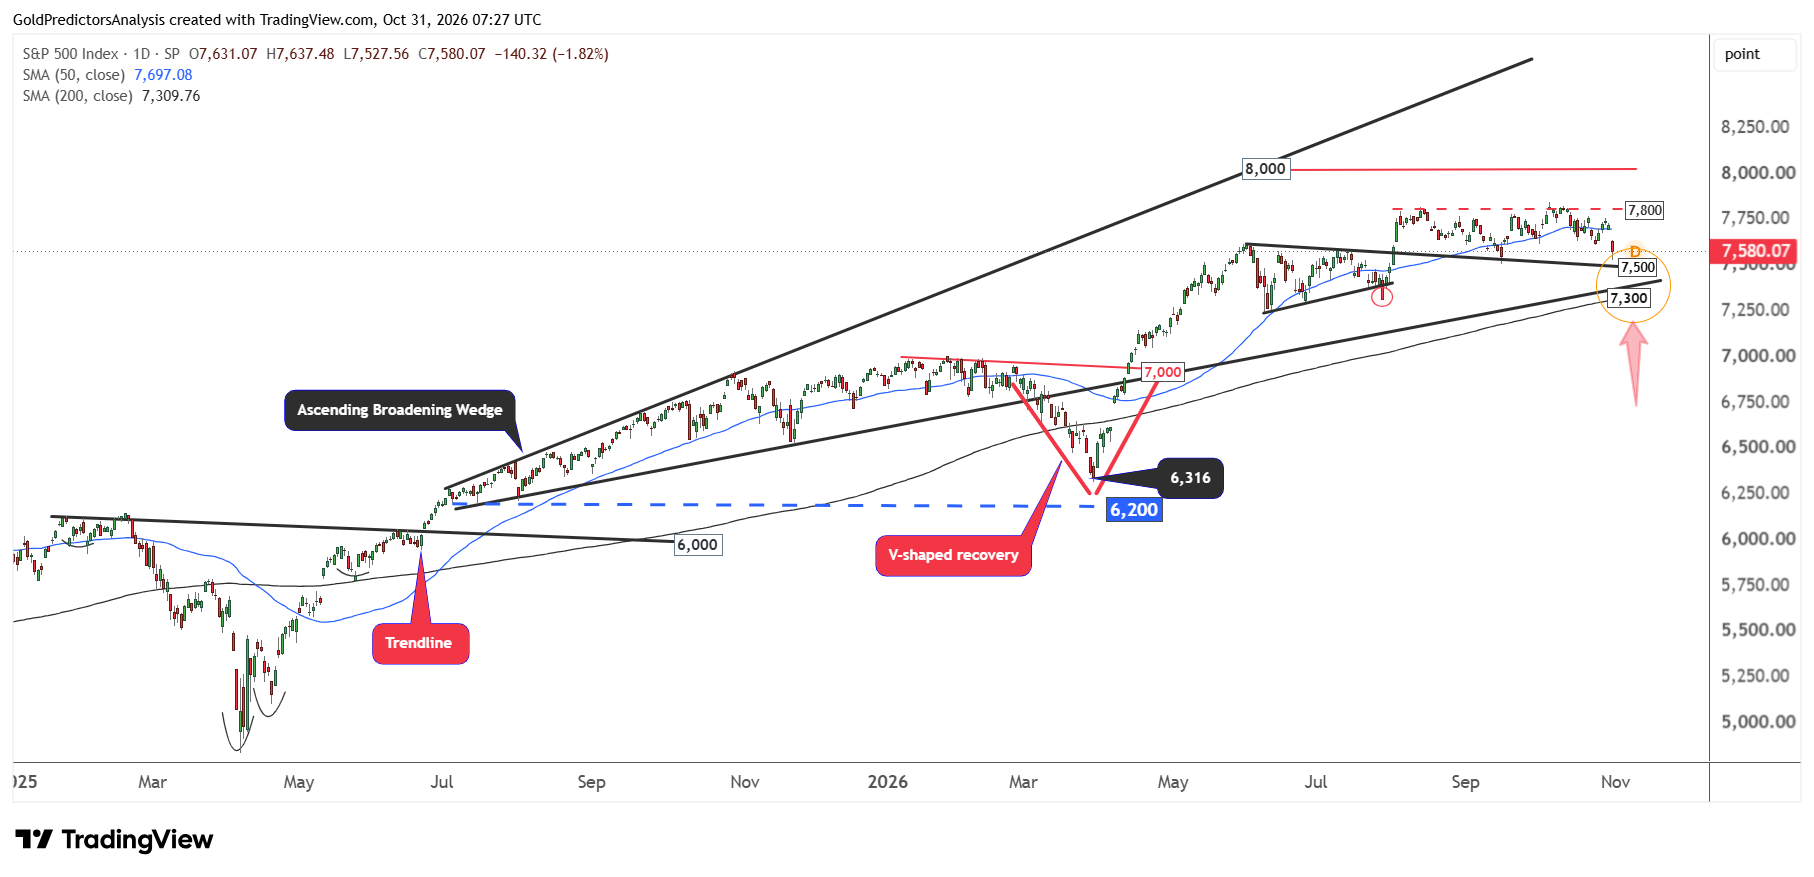
Despite this correction from the key level, the outlook for the S&P 500 still remains bullish. This bullish outlook is seen in the inverted head and shoulders formation in 2025 and then V-shaped recovery pattern in March 2026.
Multiple bullish patterns within the ascending broadening wedge suggest a constructive pattern. The support near 7,300 is also defined by the ascending broadening wedge pattern that stretches from the July 2025 lows. The index must break above the 7,800 level to push towards the 8,000 level.
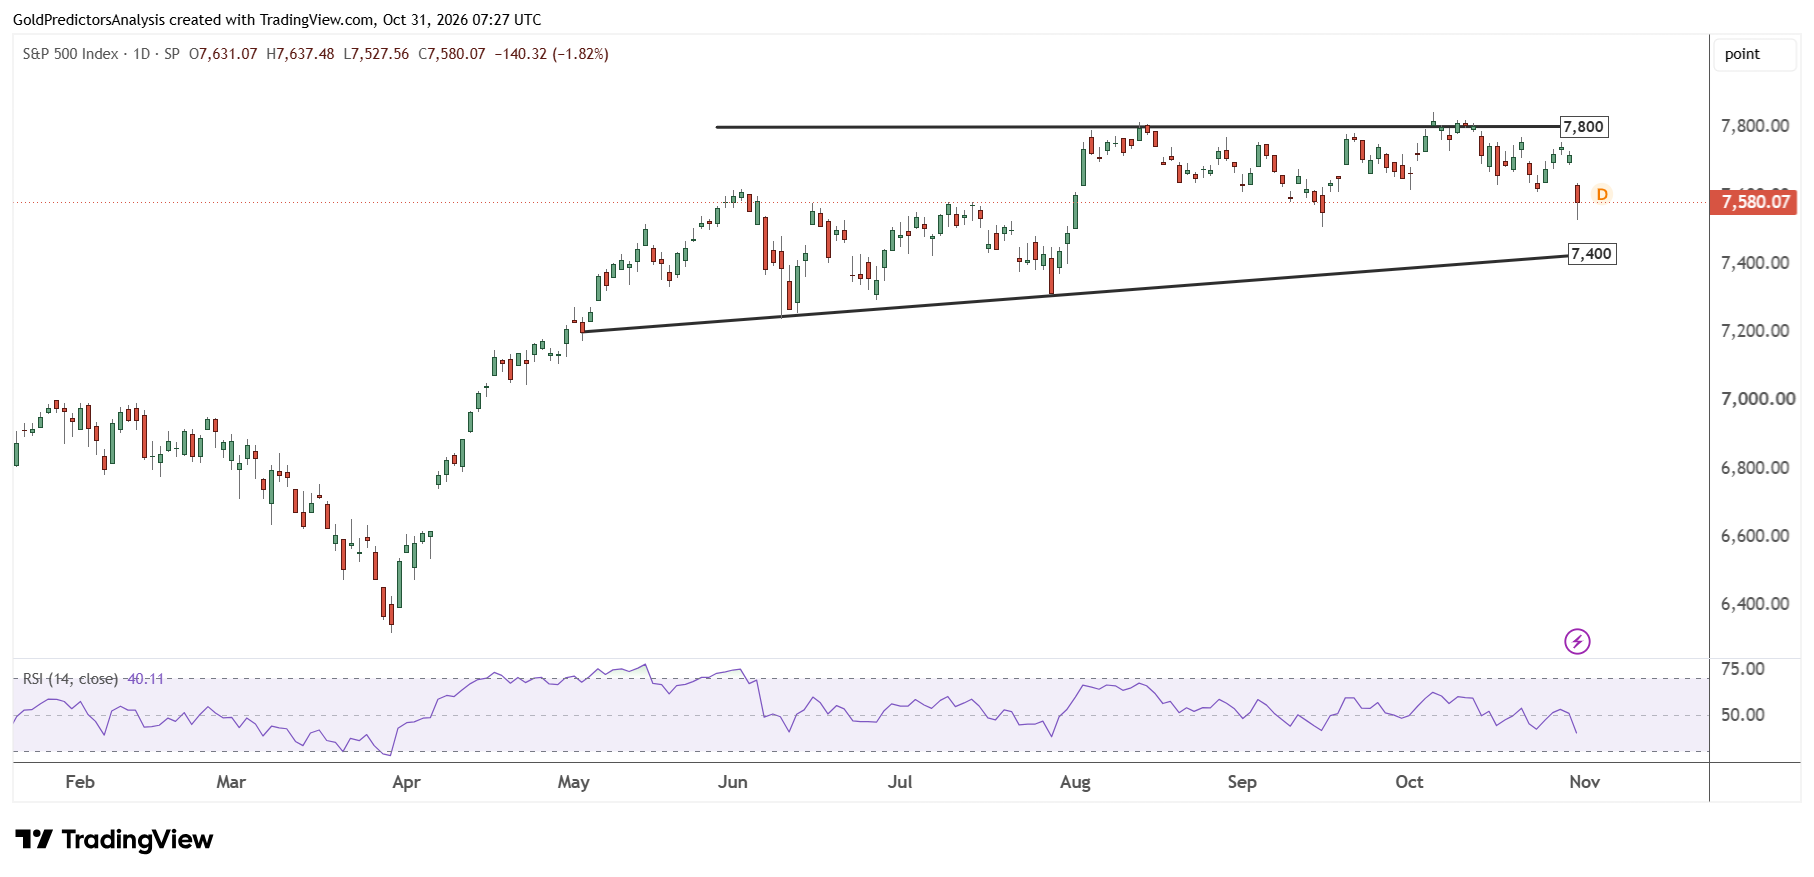
The short-term consolidation in the S&P 500 is further observed using the chart below. The chart shows that the index has been consolidating between the 7,400 and 7,800 levels during the past few months.
However, the RSI has broken below the midline, which suggests negative trend in the short term. Therefore, a break below the 7,500 level may push the index towards the 7,300 area.
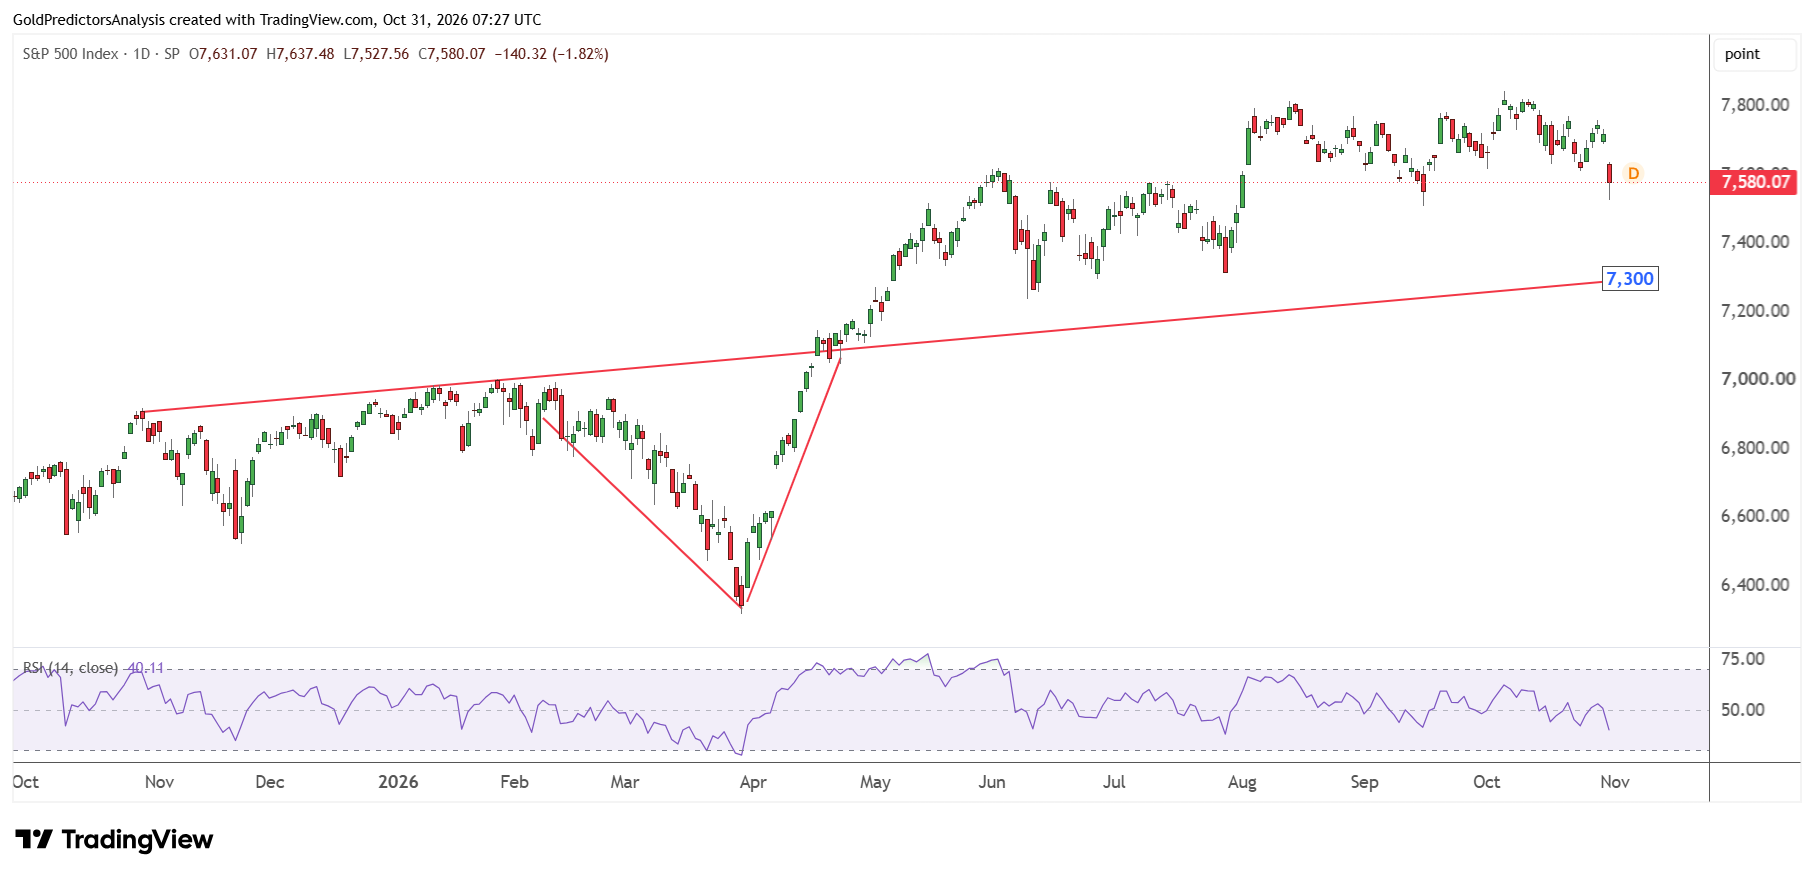
The importance of 7,300 is further observed on another chart. The chart shows that this level is defined by the ascending trend line that stretches from the October 2025 highs. Therefore, a break below 7,300 will likely open the way for further drop towards the 7,000 level.
Final Thoughts
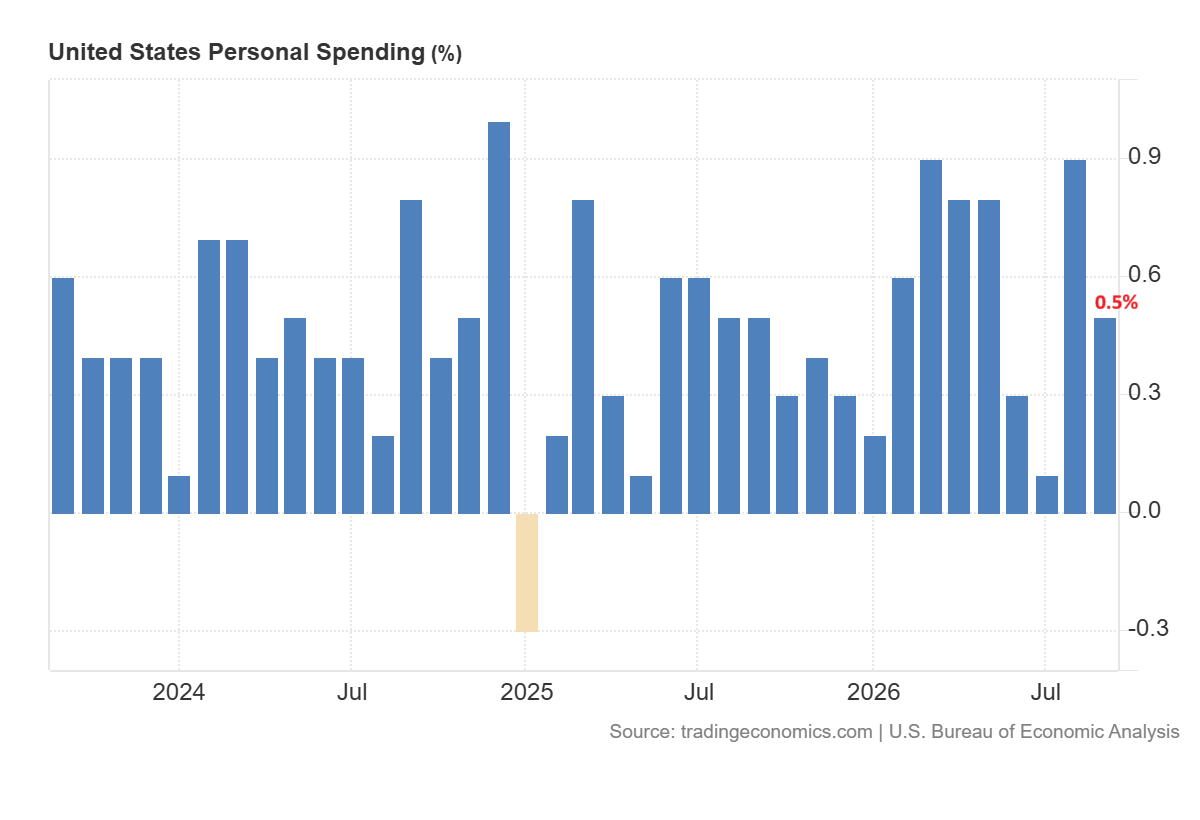
The U.S. industry is booming, driven by AI capital spending, defense spending and energy supplies. But private consumption is falling as food and beverage freight volumes are down. The housing market is also dropping. The expansion of industrial activity is lifting nominal GDP growth which may remain strong in the short term.
The surge in activity increases the demand for financing, which suggests tightening financial conditions and may push interest rates higher. But the problem is that if consumers start to suffer, they will eventually affect the outlook for top tier as sales decline and credit defaults rise.
I expect that long-term Treasury yields will continue to rise and interest rates may remain high in the short to medium term. This condition may keep the U.S. dollar strong in the short term. This may further create uncertainty for S&P 500. This uncertainty is further driven by the weakness in the technology stocks as investors question the returns on heavy AI spending. But strength in the energy sector and heavy industry offers some support to the index.
I think that technology companies may need to show some clear returns on AI spending which may produce a bottom in stocks and support strong recovery in the S&P 500.
The S&P 500 needs to break above the 7,800 level to open the way for further upside towards the 8,000 level. But the immediate support in S&P 500 remains near 7,500. The next key support is 7,300. A break below 7,300 will open the way for further downside towards the 7,000 area. In my opinion, the direction of the S&P 500 in the short term remains uncertain. The index needs to break one of these levels to find next move.