



The benchmark S&P 500 Index and the Nasdaq Composite Index are edging higher shortly after the cash market opening on Tuesday, although gains are likely being capped by concerns over the U.S. midterm elections. The indexes are also being underpinned by a drop in oil prices. Crude is lower on speculation that Iran and the U.S. were moving closer to a peace deal.
Midterm Vote Moves to Center Stage
The midterm election results could prove to be very important to the market’s direction on Wednesday. Ahead of the results, investors are noting that the prediction markets are indicating a 75% chance of the Democrats recapturing the Senate.
One worry for investors is a sweep of both the House and the Senate by the Democrats. Especially vulnerable is the tech sector, particularly artificial intelligence stocks. However, if Republicans continue to hold on to the Senate or both chambers, the major stock indexes could firm.
What I’m seeing is general anxiety ahead of a major event, but there doesn’t appear to be a feeling of doom and gloom like some analysts projected after Friday’s steep sell-off. There may be some short-term volatility, but I expect investors to return quickly to the key fundamentals such as oil prices, inflation, Fed policy and AI-project funding issues.
Apple Weakness Has Yet to Spread
Looking at the early movement in the market, Apple is down about 3%, but that’s earnings-related. It doesn’t seem to be having any impact on other tech giants like Micron Technology, Nvidia, Advanced Micro Devices, Broadcom and Intel, which are all up about 3%.
Dow Jones Price Forecast
Every new Dow Jones analysis as it publishes, today's technical signal and key levels, live price — on one page.
See all Dow Jones forecastsDaily Nasdaq Composite Index (IXIC) Technical Analysis
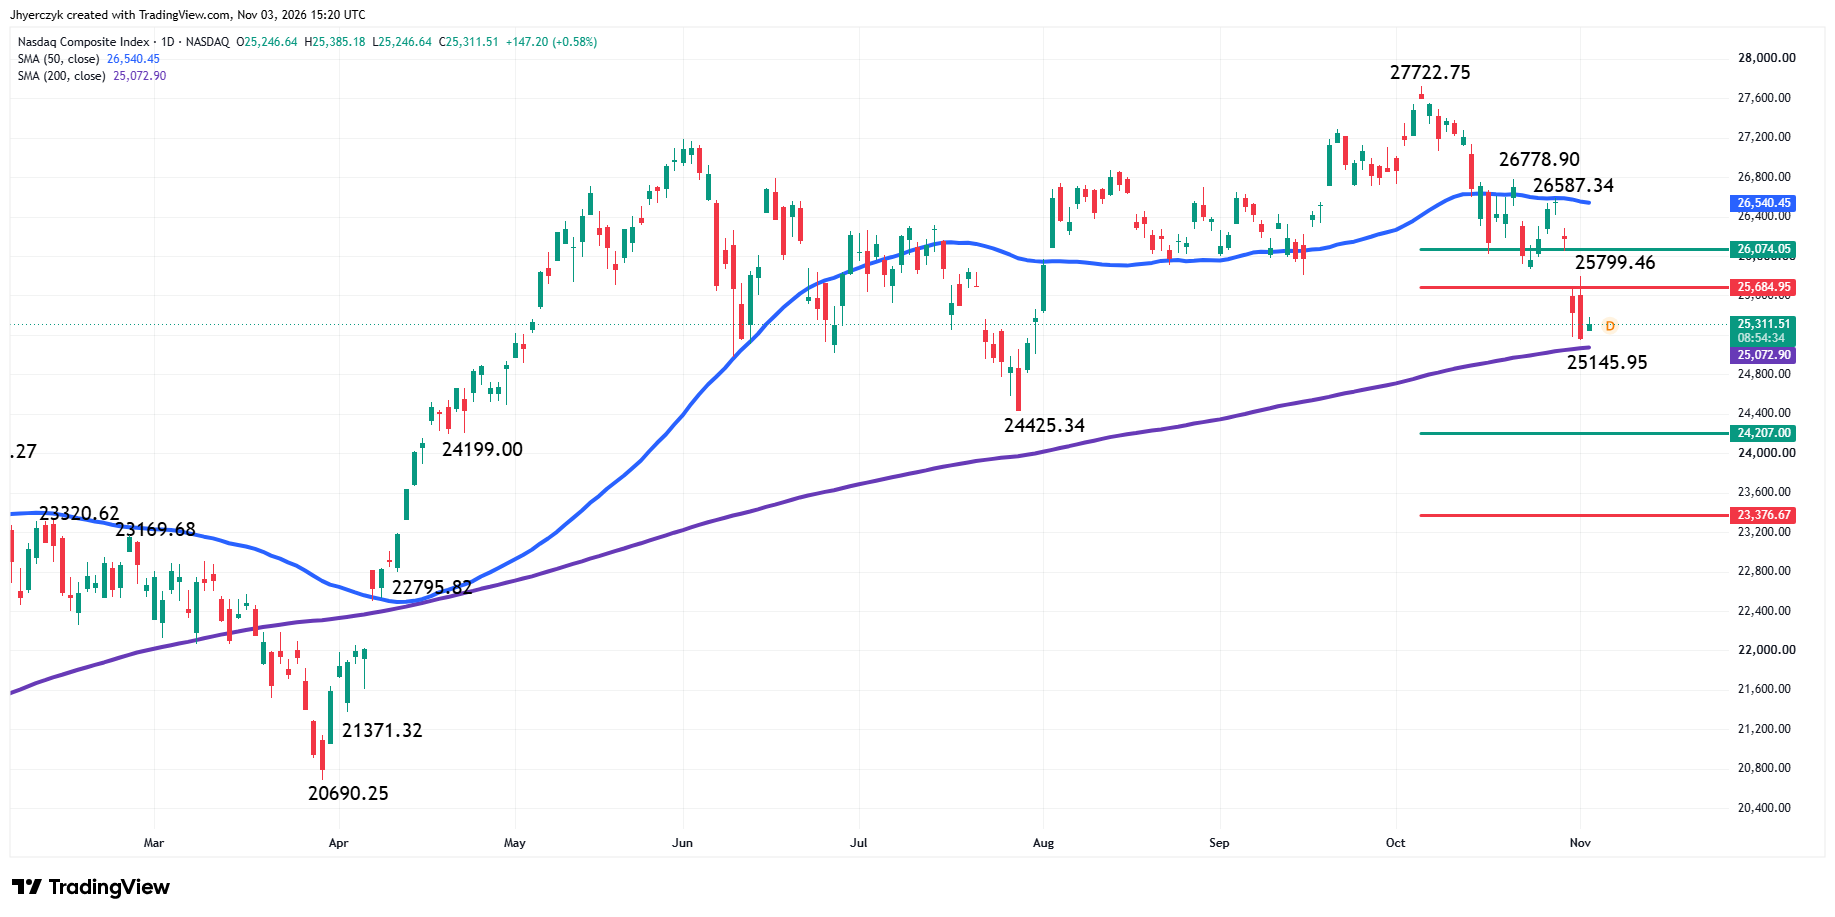
The index is trading inside yesterday’s wide range, which suggests that traders are being indecisive.
The main trend is down according to the daily swing chart. A trade through 26587.34 will change the main trend to up. Taking out 25145.95 will signal a resumption of the downtrend.
The minor trend is also down. A trade through 25799.46 will change the minor trend to up and turn momentum to the upside.
My work is focusing on only two zones. The short-term range is 24425.34 to 27722.75. Its retracement zone at 25684.95 to 26074.05 is resistance.
The long-term range is 20690.25 to 27722.75. Its retracement zone support is 24207.00 to 23376.67.
On the upside, the 50-day moving average at 26540.45 is potential resistance and a trigger point for an acceleration to the upside. On the downside, the major moving average to watch is the 200-day at 25072.90. We could see a technical bounce on the first test of this indicator, but if it fails, the index could extend lower to the July 29 main bottom at 24425.34 and then the long-term retracement zone.
Daily S&P 500 Index (SPX) Technical Analysis
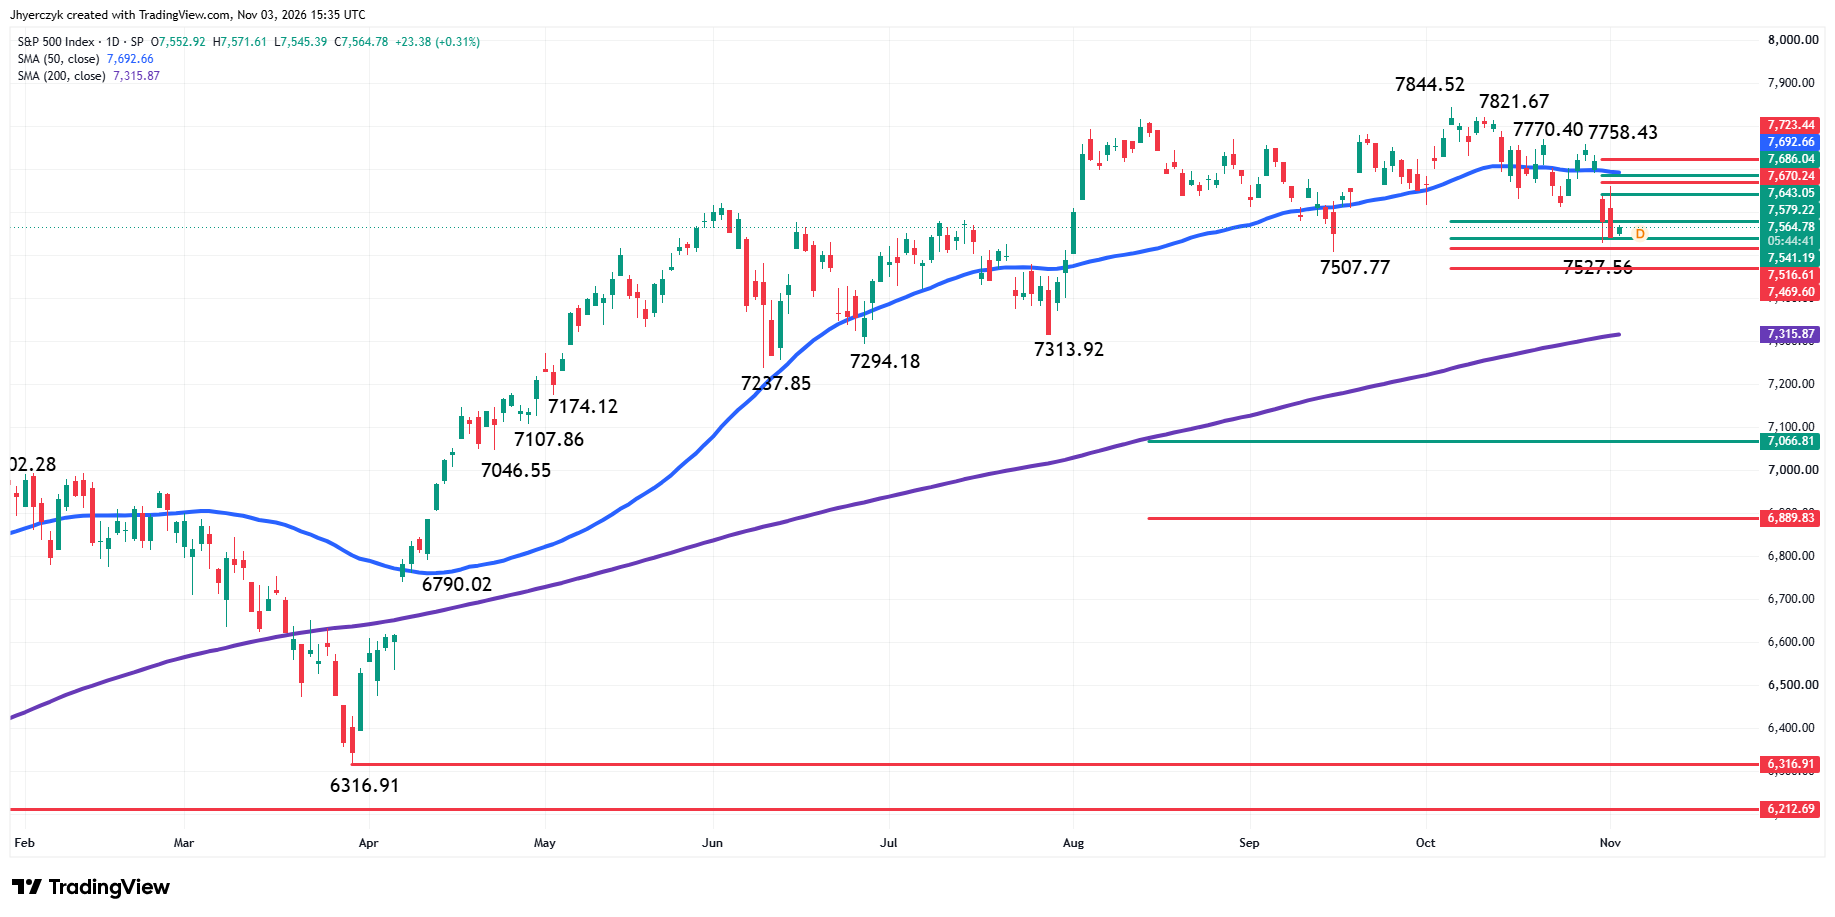
The S&P 500 Index is trading inside yesterday’s range, suggesting trader indecision.
The main trend is down according to the daily swing chart. A trade through 7758.43 will change the main trend to up. Taking out 7527.56 will signal a resumption of the downtrend.
The minor trend is also down. A trade through 7662.23 will change the minor trend to up and possibly turn momentum to the upside.
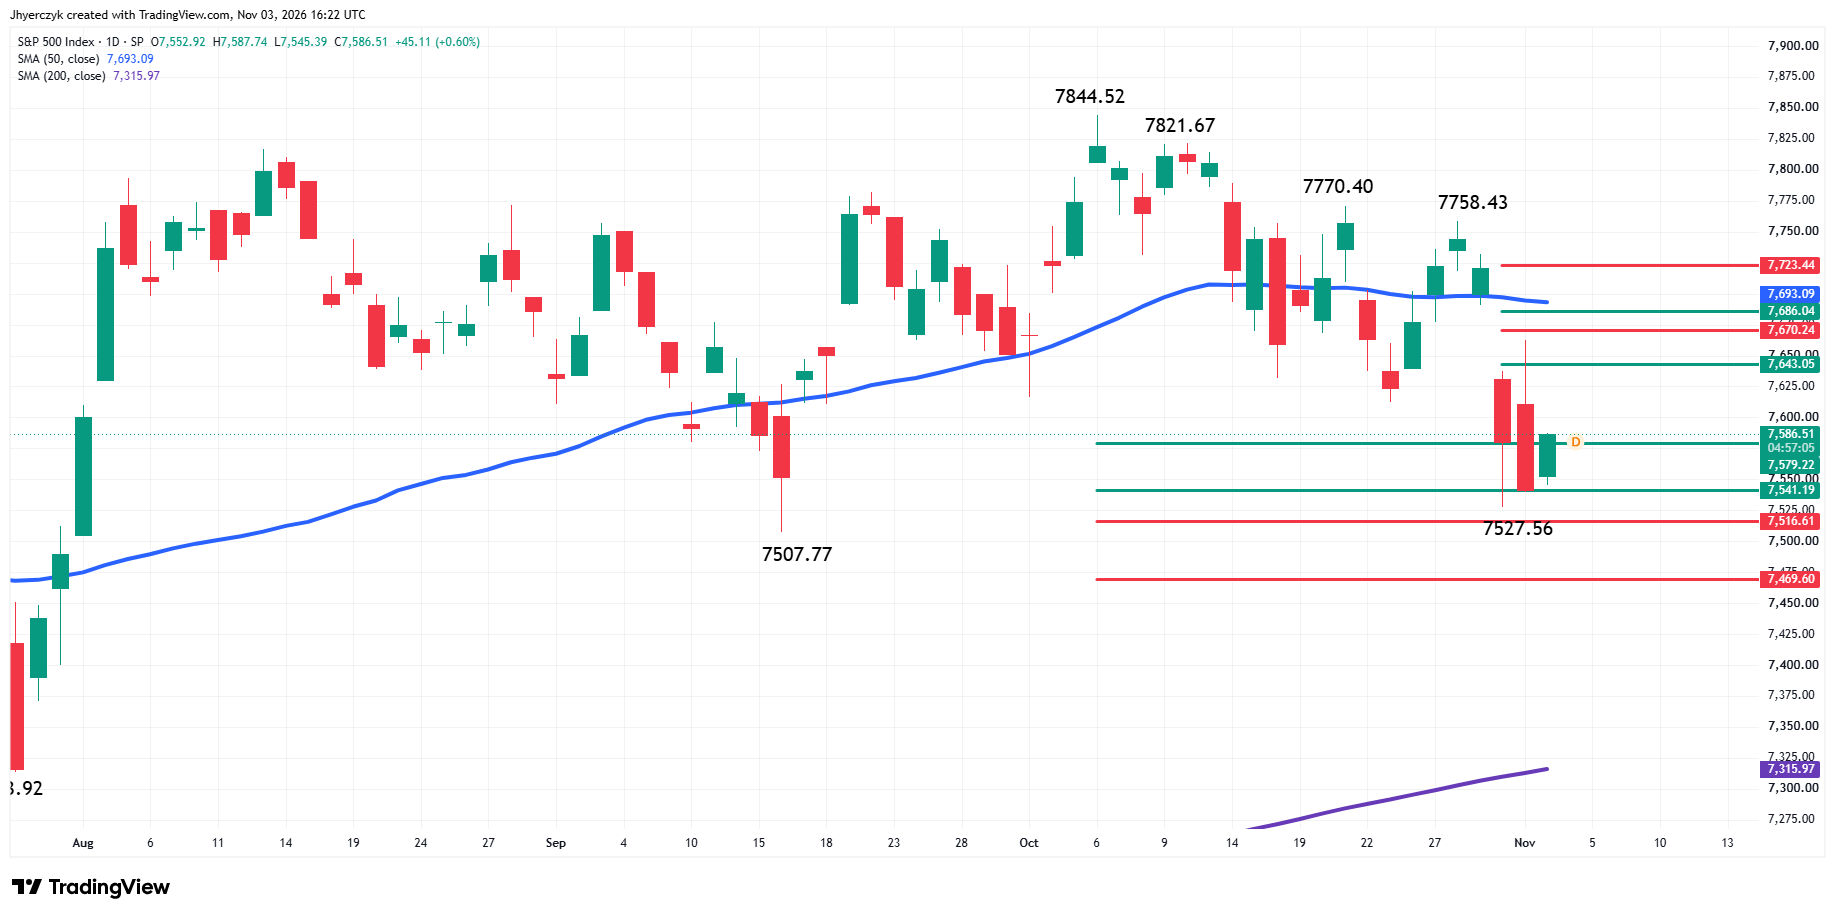
The short-term range is 7758.43 to 7527.56. Its retracement zone at 7643.05 to 7670.24 is the first resistance zone. Yesterday’s rally stopped inside this zone at 7662.23.
Another short-term range is 7844.52 to 7527.56. Its retracement zone at 7686.04 to 7723.44 is resistance. Inside this zone is the 50-day moving average at 7692.66.
The first intermediate range is 7313.92 to 7844.52. Its retracement zone at 7579.22 to 7516.61 is support. This area stopped the selling at 7527.56 on Friday.
The second intermediate range is 7237.85 to 7844.52. Its retracement zone at 7541.19 to 7469.60 is another support area.
The long-term range is 6316.91 to 7816.70. Its retracement zone at 7066.81 to 6889.83 is a major downside target and value zone.
The 50-day moving average at 7692.66 is resistance and the 200-day moving average at 7315.87 is potential support.
What to Watch
Nasdaq Composite Index (IXIC)
The trade under the major retracement zone at 25684.95 to 26074.05, the trade on the weak side of the 50-day moving average at 26540.45 and the downtrend on the swing chart are supporting my downside bias. Taking out the 200-day moving average at 25072.90 will reaffirm my outlook, with 24207.00 to 23376.67 a potential target area.
My bias will weaken if buyers can overcome the 50% level at 26074.05. A move over the 50-day moving average will likely cause me to turn bullish.
S&P 500 Index (SPX)
Trading below the 50-day moving average and the downtrend on the daily main swing chart are supporting my downside bias. The inability to trade through the 61.8% level at 7670.24 and the break back under the 50% level at 7643.05 indicate that sellers may be defending the downtrend.
Another major area to watch on the upside is the 50% level at 7686.04. My bias will weaken if buyers overcome the 50-day moving average.
If the selling pressure resumes, then look for a test of the series of retracement levels at 7541.19, 7516.61 and 7469.60. The latter is a potential trigger point for an acceleration into the 200-day moving average at 7315.87.
A break under the 200-day moving average will likely lead to a test of the long-term retracement zone at 7066.81 to 6889.83.