


The benchmark S&P 500 Index closed sharply lower on Monday. The broad-based index is being dragged lower by a plunge in its technology sector as traders responded to more negative news surrounding Nvidia.
The index opened weaker but stabilized for about an hour as traders debated whether the Nvidia board would consider bringing back Jensen Huang as its chief executive officer. The selling resumed when a source familiar with the matter told CNBC that the chipmaker’s board is not discussing giving Huang a second chance.
Chip Restrictions Add to Nvidia Pressure
Weighing on AI chipmakers and software makers initially was pressure from the Commerce Department. On Monday, it was announced that it was moving to close a loophole that allowed Chinese firms to rent Nvidia’s computing power located in foreign countries. Meanwhile, Treasury Secretary Scott Bessent over the weekend fanned the bearish flames by calling for a “dramatic shakeup” at the company. He also went one step further, urging Nvidia’s board to consider candidates for the CEO position from outside the company.
Today’s continued sell-off may be an indication that investors are selling the smoke and not waiting for the fire. They may feel that it’s better to be out than go through the volatility associated with the continuing bad news. Furthermore, the company is set to release its third quarter earnings report after the close on Tuesday. Although the report is expected to show strong results, investors will be more focused on what interim CEO Colette Kress has to say at the post-earnings press conference about the company’s future growth plans.
Nvidia Daily Technical Analysis
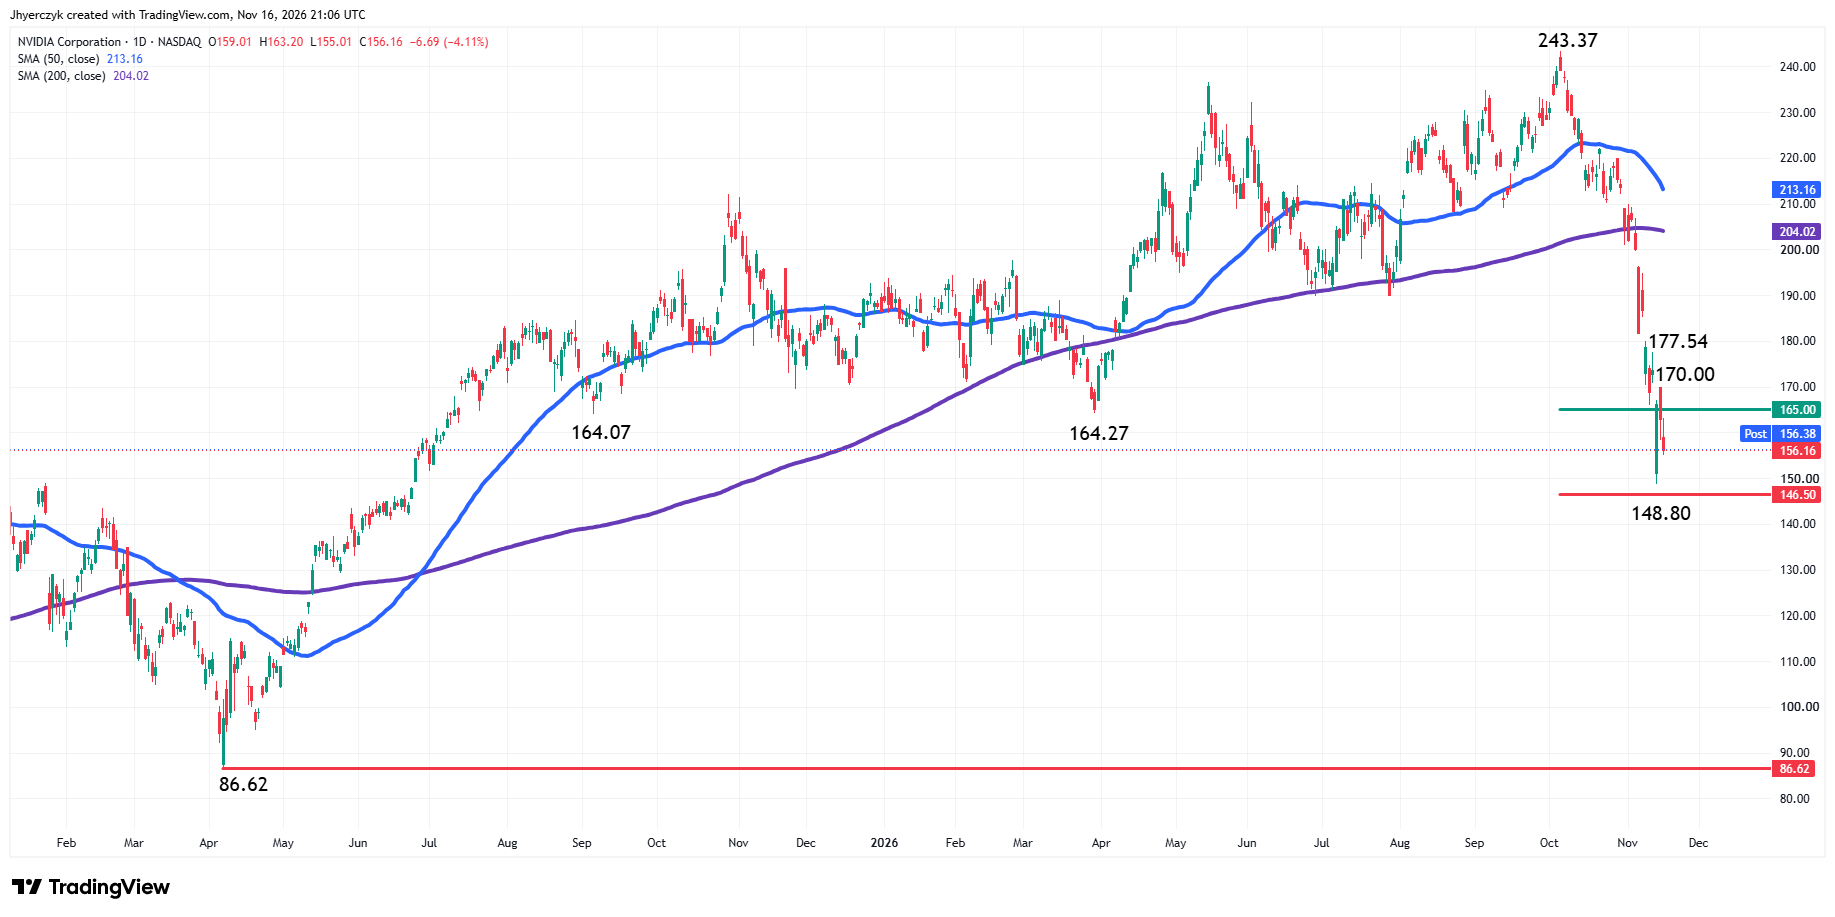
Technically, Nvidia is in a steep downtrend on the daily chart. The main trend will change to up on a move through $243.37. A trade through last week’s low at $148.80 will signal a resumption of the downtrend.
The minor trend is also down. A trade through $170.00 will change the minor trend to up and possibly shift momentum to the upside. Overtaking another minor top at $177.54 will solidify the move in momentum.
The long-term range measured by the April 7, 2025 main bottom at $86.62 to the October 6, 2026 main top at $243.37, has formed a 50% to 61.8% retracement zone at $165.00 to $146.50. Nvidia closed inside this zone at $156.16. Trader reaction to this area is likely to determine the near-term direction.
A bullish move could develop on a sustained move over the upper or 50% level at $165.00. If this move generates enough upside momentum then we could see a trade through the two minor tops at $170.00 and $177.54. Overtaking these levels could even drive buyers into the 200-day moving average resistance at $204.02 and the 50-day moving average at $213.16.
The failure to overtake $165.00 with conviction and a breakdown under the lower or 61.8% level at $146.50 could lead to an even steeper decline with the next major targets the psychological $100.00 level and the main bottom at $86.62.
Daily S&P 500 Index (SPX) Technical Analysis
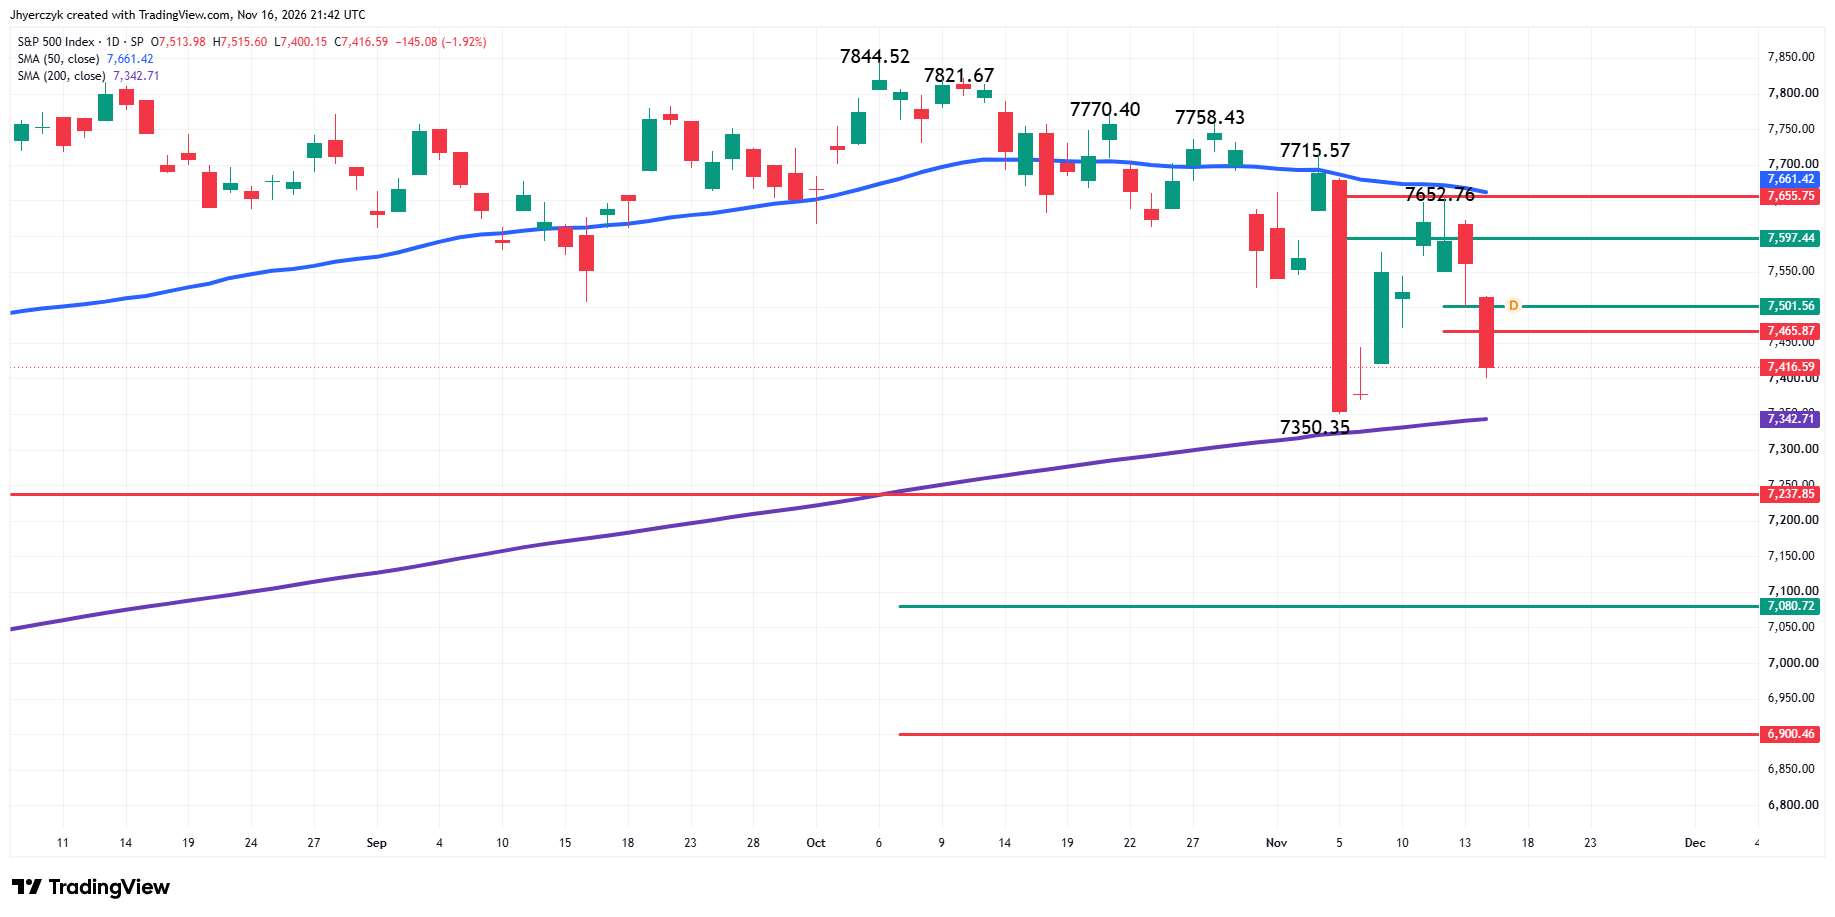
The S&P 500 Index settled sharply lower on Monday. The main trend is down according to the daily swing chart. A new main top was formed at 7652.76. A trade through this level will change the main trend to up. Taking out the swing bottom at 7350.35 will signal a resumption of the downtrend.
The short-term range is 7350.35 to 7652.76. Its retracement zone is 7501.56 to 7465.87. On Monday, the index closed on the weak side of this zone, turning it into resistance.
The intermediate range is 7844.52 to 7350.35. Its retracement zone at 7597.44 to 7655.75 is another resistance zone. It comes in just in front of the 50-day moving average at 7661.42, which is both resistance and a trend indicator. The intermediate 61.8% level at 7655.75 forms a tight resistance cluster with the 50-day moving average at 7661.42.
The main range is 6316.91 to 7844.52. Its retracement zone at 7080.72 to 6900.46 is the next major downside target and potential value zone.
The downtrend on the swing chart and the trade on the bearish side of the 50-day moving average are supporting my downside bias. This bias will be tested on the downside by the main bottom at 7350.35 and the 200-day moving average at 7342.71, where a technical bounce could occur. A failure at the 200-day moving average will indicate the selling pressure is getting stronger with swing bottoms at 7313.92 and 7237.85 the next targets.
The June 9 main bottom at 7237.85 is a potential trigger point for an acceleration to the downside with the major long-term retracement zone at 7080.72 to 6900.46 the primary downside target.
My bearish outlook will weaken if buyers can overcome the short-term 50% level at 7501.56.
More Information in our Economic Calendar.