



The major U.S. stock indexes are edging higher at the mid-session on Monday. The markets rallied sharply higher shortly after the opening, but have since given back most of those gains. A rise in tech stocks may have given the indexes an early boost. This may have been a relief rally after Friday’s steep plunge.
Position-squaring and short-covering ahead of major earnings reports and Tuesday’s upcoming midterm elections may have also contributed to the early strength.
Oil Drop Provides the Spark
The main catalyst behind the rally was likely the 6% drop in crude oil prices. Traders sold crude oil hard amid hopes of a peace deal between the United States and Iran. President Trump was likely the main driver of the weakness. He said over the weekend that he “hasn’t made a decision” to attack Iran. He also said he would prefer a peaceful resolution to the conflict.
Cyclical Shares Lead the Advance
Traders continued to rotate into cyclical shares. The best-performing sectors were consumer discretionary, financials, industrials and materials. A few of last week’s losers managed a small recovery, including Amazon, Nvidia and Alphabet.
Earnings and Elections Remain Ahead
Looking ahead, Apple is expected to report after the close. McDonald’s and Qualcomm are also scheduled to release their quarterly results.
Daily S&P 500 Index (SPX) Technical Analysis
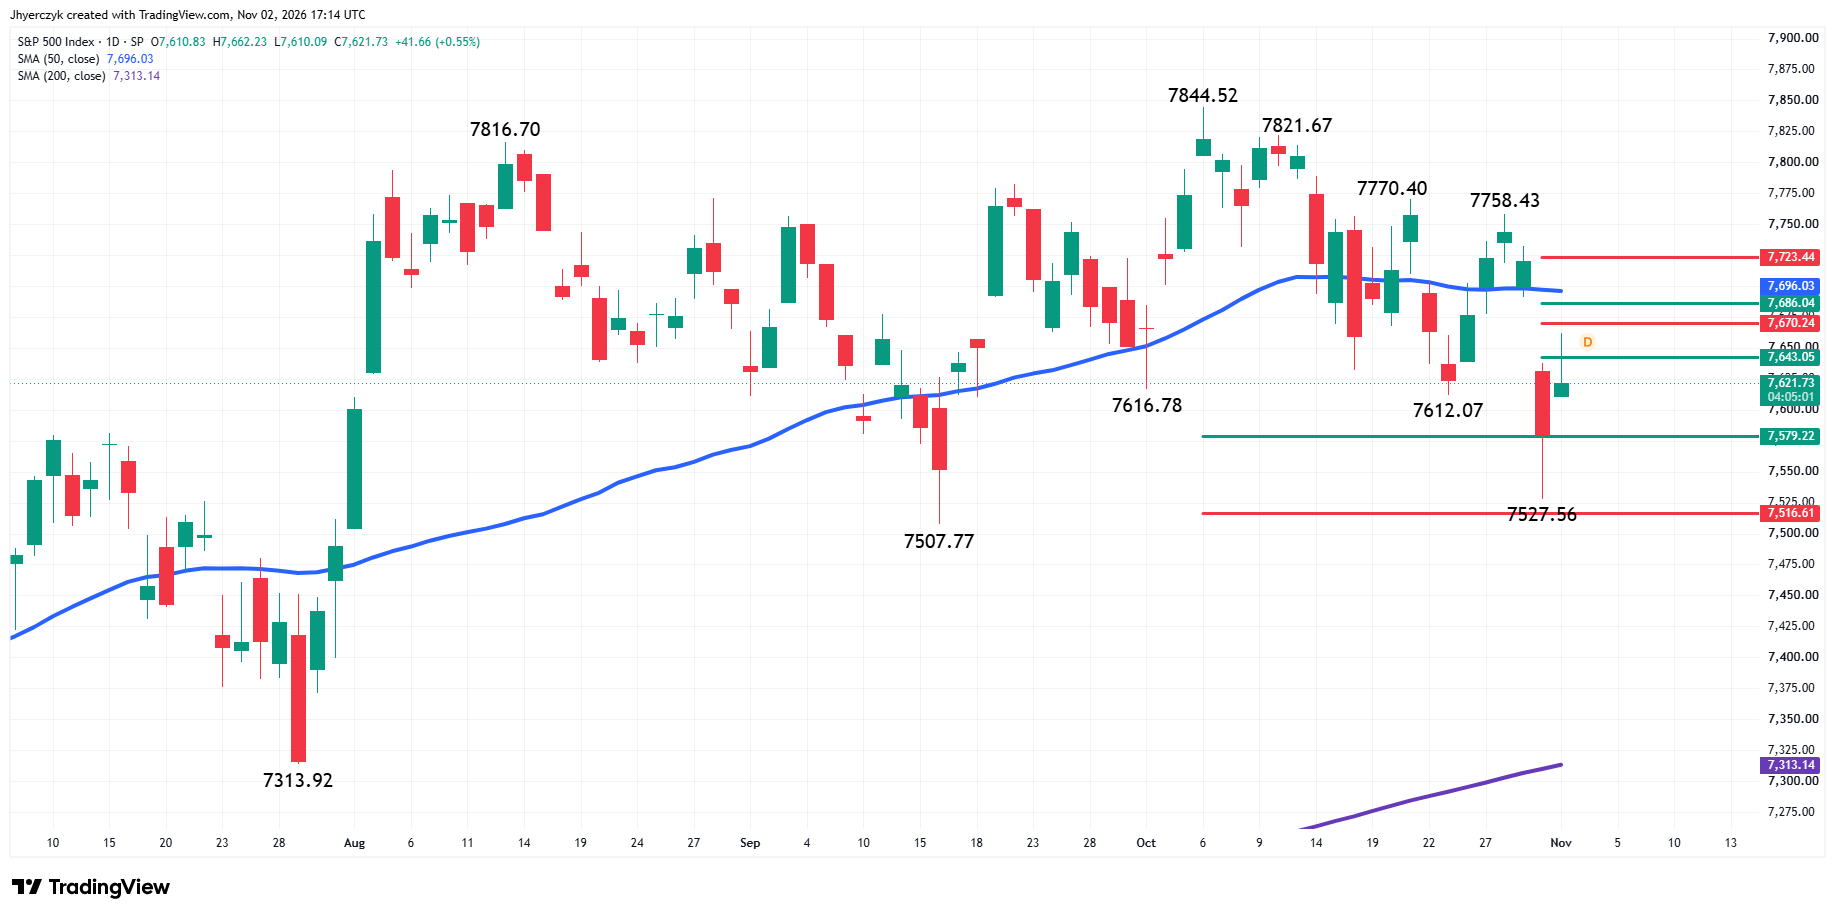
The benchmark S&P Index is trading higher at the mid-session on Monday. The main trend is down according to the daily swing chart. A trade through 7758.43 will change the main trend to up. Taking out Friday’s low at 7527.56 will signal a resumption of the downtrend.
Dow Jones Price Forecast
Every new Dow Jones analysis as it publishes, today's technical signal and key levels, live price — on one page.
See all Dow Jones forecastsThe minor trend is also down. Today’s rally through Friday’s high turned 7527.56 into a new minor bottom.
The long-term range is 7313.92 to 7844.52. Its retracement zone at 7579.22 to 7516.61 is major support. This area stopped the selling at 7527.56 on Friday.
The short-term range is 7758.43 to 7527.56. Its retracement zone at 7643.05 to 7670.24 is the first resistance zone. Today’s rally stopped inside this zone at 7662.23.
The intermediate range is 7844.52 to 7527.56. Its retracement zone at 7686.04 to 7723.44 is the next potential upside target and resistance zone. Inside this zone is the 50-day moving average at 7696.14. The 50-day moving average is both resistance and a trend indicator, although recent activity suggests it may be acting more like a pivot.
Daily Nasdaq Composite Index (IXIC) Technical Analysis
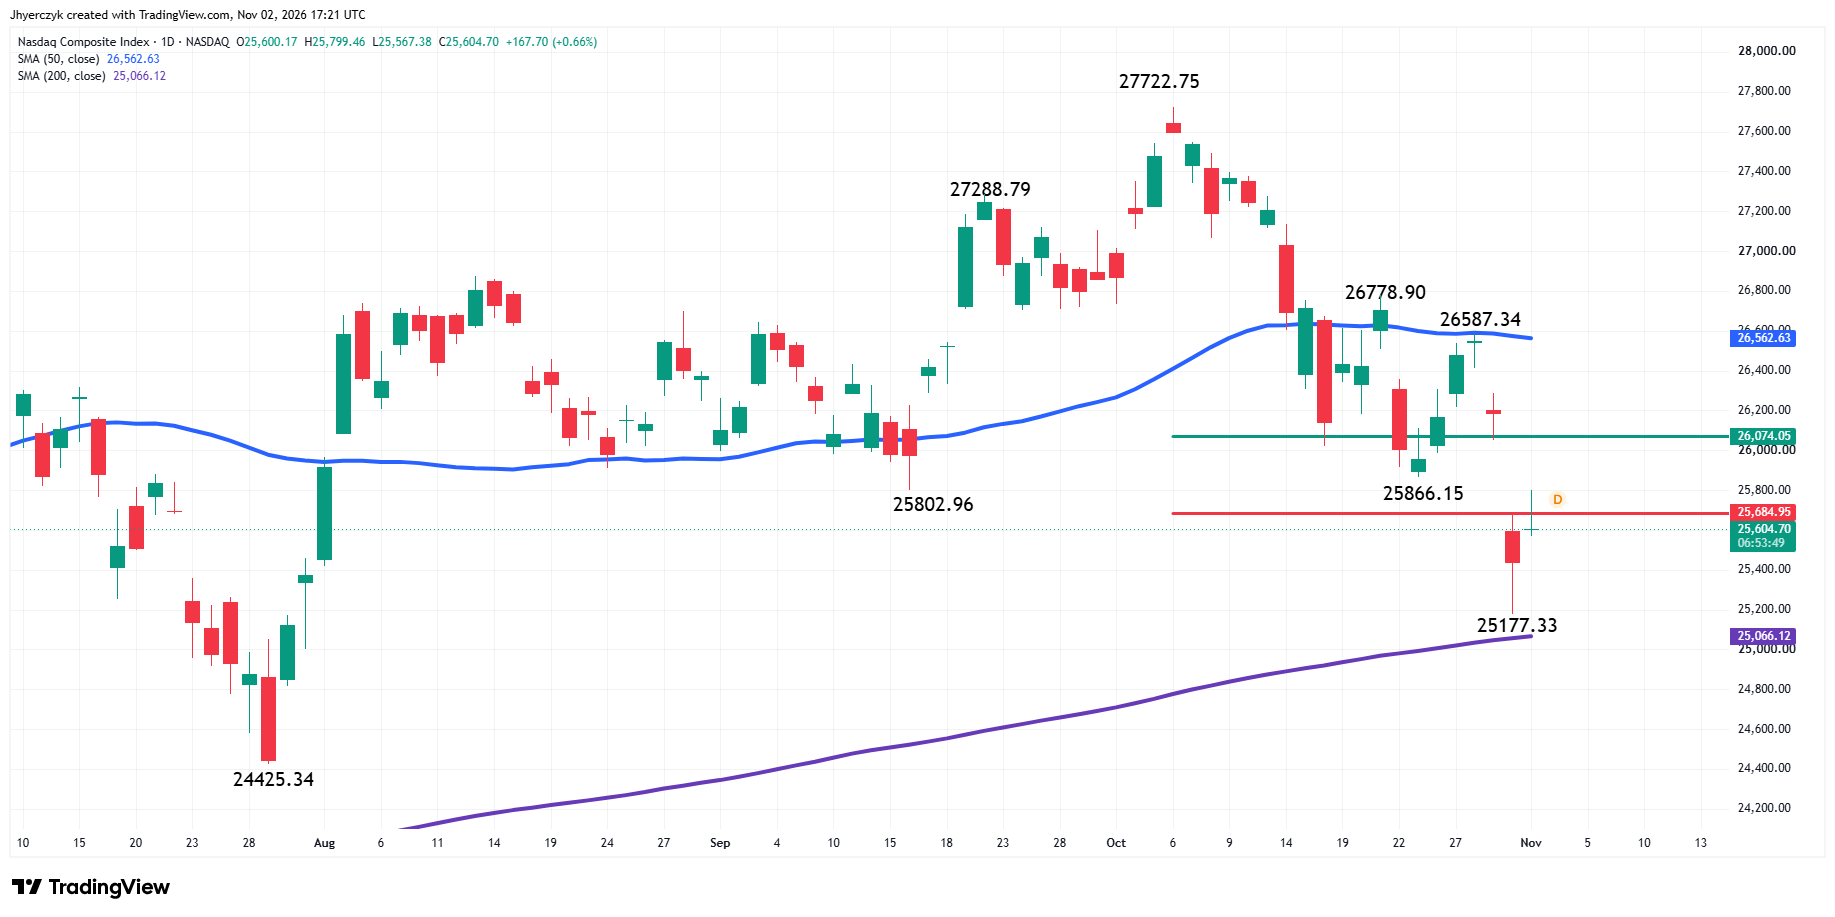
The Nasdaq Composite Index is up, but off its high at the midsession on Monday. The main trend is down according to the daily swing chart, which makes today’s rally look like a technical bounce. Furthermore, there is no base to provide support.
A trade through 25177.33 will signal a resumption of the downtrend. Taking out 26587.34 will change the main trend to up. Taking out 26778.90 will reaffirm the change in trend.
The long-term range is 24425.34 to 27722.75. Its retracement zone at 25684.95 to 26074.05 is resistance. Today’s rally to 25799.46 stopped inside this zone.
On the upside, the 50-day moving average at 26561.79 is potential resistance and trigger point for an acceleration to the upside. On the downside, the major moving average to watch is the 200-day at 25065.95. We could see a technical bounce on the first test of this indicator, but if it fails, the index could collapse into July 29 main bottom at 24425.34.
What to Watch
S&P 500 Index (SPX)
Trading below the 50-day moving average and the downtrend on the daily main swing chart are supporting my downside bias. The inability to trade through the 61.8% level at 7670.24 and the break back under the 50% level indicate that sellers may be defending the downtrend.
Another major area to watch on the upside is the 50% level at 7686.04. My bias will weaken if buyers overcome the 50-day moving average.
If the selling pressure resumes then look for a test of the long-term 50% level at 7579.22. The failure to break this level will also weaken my downside bias. However, a trade through it will strengthen my bias with 7527.56 to 7516.61 the next major target zone.
Nasdaq Composite Index (IXIC)
The trade under the major retracement zone at 25684.95 to 26074.05, the trade on the weak side of the 50-day moving average at 26561.79 and the downtrend on the swing chart are supporting my downside bias. Taking out the 200-day moving average at 25065.95 will reaffirm my outlook.
My bias will weaken if buyers can overcome the 50% level at 26074.05. A move over the 50-day moving average will likely cause me to turn bullish.