



Market Overview
U.S. stocks sold off sharply Friday, ending a week of heavy losses. The Dow Jones Industrial Average closed at 48,147.33, down 8.02% for the week. The Nasdaq Composite fell 10.02% to 22,617.73, while the S&P 500 lost 8.61% to finish at 6,910.39.
Nvidia’s earnings beat and increased 2028 revenue guidance failed to restore confidence in AI stocks. Anthropic’s initial public offering also failed to stop the selling. Investors remain concerned about the financing needed for data center construction and the returns from AI spending.
Inflation and the possibility of further Federal Reserve rate hikes remain concerns. October retail sales increased, and the control-group measure rose 0.6%, above the 0.3% consensus forecast. Investors will watch for further signs of consumer strength as the holiday shopping season begins.
The week ahead brings the PCE price index, consumer confidence and GDP, along with earnings from Analog Devices, Dell and Deere. U.S. markets are closed Thursday for Thanksgiving and close early Friday.
Key Economic Releases & Notable Earnings
Calendar times are converted from Eastern Time to GMT.
Monday, November 23
Earnings Before the Open
No reports scheduled
Economic Releases
14:45 GMT, Flash Manufacturing PMI, forecast 54.5 (prior 54.9)
14:45 GMT, Flash Services PMI, forecast 55.6 (prior 56.1)
Earnings After the Close
Agilent (A), est. EPS $1.73 per share
Central Garden (CENT), est. EPS -0.06
Compass Minerals (CMP), est. EPS 0.42
Fluence (FLNC), est. EPS -0.45
Hewlett Packard Enterprises (HPE), est. EPS 1.28
Jacobs Solutions (J), est. EPS 2.12
Semtech (SMTC), est. EPS 1.13
Symbotic (SYM), est. EPS 0.07
Zoom Communications (ZM), est. EPS 1.49
Tuesday, November 24
Earnings Before the Open
Abercrombie & Fitch (ANF), est. EPS $3.08 per share
Analog Devices (ADI), est. EPS $3.88
Analog Devices is expanding its exposure to AI infrastructure, power management and data centers. Revenue is estimated at $4.32 billion, up 40.4% year over year.
Best Buy (BBY), est. EPS 1.49
Bilibili (BILI), est. EPS 1.79
Burlington Stores (BURL), est. EPS 1.73
Dick’s Sporting Goods (DKS), est. EPS 1.42
Dollar Tree (DLTR), est. EPS 0.91
Dycom (DY), est. EPS 4.59
J.M. Smucker (SJM), est. EPS 2.56
Kingsoft Cloud (KC), est. EPS -0.30
Kohl’s (KSS), est. EPS 0.00
Medtronic (MDT), est. EPS 1.33
MiniMed (MMED), est. EPS 0.12
Shoe Station Group (SHOE), est. EPS 0.24
Economic Releases
13:15 GMT, ADP Weekly Employment Change (prior 23.8K)
14:00 GMT, HPI m/m, forecast 0.2% (prior 0.3%)
14:00 GMT, S&P/CS Composite-20 HPI y/y, forecast 2.7% (prior 2.7%)
15:00 GMT, CB Consumer Confidence, forecast 92.1 (prior 91.7)
15:00 GMT, Richmond Manufacturing Index, forecast -3 (prior -2)
Earnings After the Close
Dell Technologies (DELL), est. EPS $6.59
Dell is expected to report revenue of $49.2 billion, up 82% year over year. Investors will watch AI server demand, storage pricing and fiscal 2027 fourth-quarter guidance.
Ambarella (AMBA), est. EPS $0.31 per share
Autodesk (ADSK), est. EPS 3.07
HP (HPQ), est. EPS 0.75
Nutanix (NTNX), est. EPS 0.61
Workday (WDAY), est. EPS 2.74
Wednesday, November 25
Earnings Before the Open
Deere (DE), est. EPS $4.06
The farm equipment maker is expected to report revenue of $10.3 billion, down from $10.6 billion a year earlier. Investors will watch its fiscal 2027 guidance for signs of a recovery.
Li Auto (LI), est. EPS -$0.72 per share
Economic Releases
13:30 GMT, Core PCE Price Index m/m, forecast 0.3% (prior 0.3%)
13:30 GMT, Prelim GDP q/q, forecast 3.5% (prior 3.4%)
13:30 GMT, Prelim GDP Price Index q/q, forecast 2.3% (prior 2.3%)
13:30 GMT, Unemployment Claims, forecast 201K (prior 203K)
13:30 GMT, Core Durable Goods Orders m/m, forecast 0.5% (prior 0.5%)
13:30 GMT, Durable Goods Orders m/m, forecast 0.5% (prior 1.9%)
13:30 GMT, Personal Income m/m, forecast 0.4% (prior 0.2%)
13:30 GMT, Personal Spending m/m, forecast 0.4% (prior 0.5%)
15:00 GMT, New Home Sales, forecast 649K (prior 676K)
Earnings After the Close
No reports scheduled
Thursday, November 26
U.S. holiday: Thanksgiving. U.S. stock markets are closed.
Earnings Before the Open
No reports scheduled
Economic Releases
No releases scheduled
Earnings After the Close
No reports scheduled
Friday, November 27
Earnings Before the Open
No reports scheduled
Economic Releases
13:30 GMT, Goods Trade Balance, forecast -134.4B (prior -135.1B)
13:30 GMT, Prelim Wholesale Inventories m/m, forecast 0.7% (prior 0.7%)
Earnings After the Close
No reports scheduled
Dow Jones Price Forecast
Every new Dow Jones analysis as it publishes, today's technical signal and key levels, live price — on one page.
See all Dow Jones forecastsCentral Bank Activity
Monday, November 23
John Williams (New York Fed President), 21:00 GMT
Wednesday, November 25
Federal Reserve Beige Book, 19:00 GMT
Traders will monitor Williams’ comments on the economy, inflation and interest rates as markets assess the possibility of further rate hikes.
Technical Outlook
Weekly Dow Jones Industrial Average Index
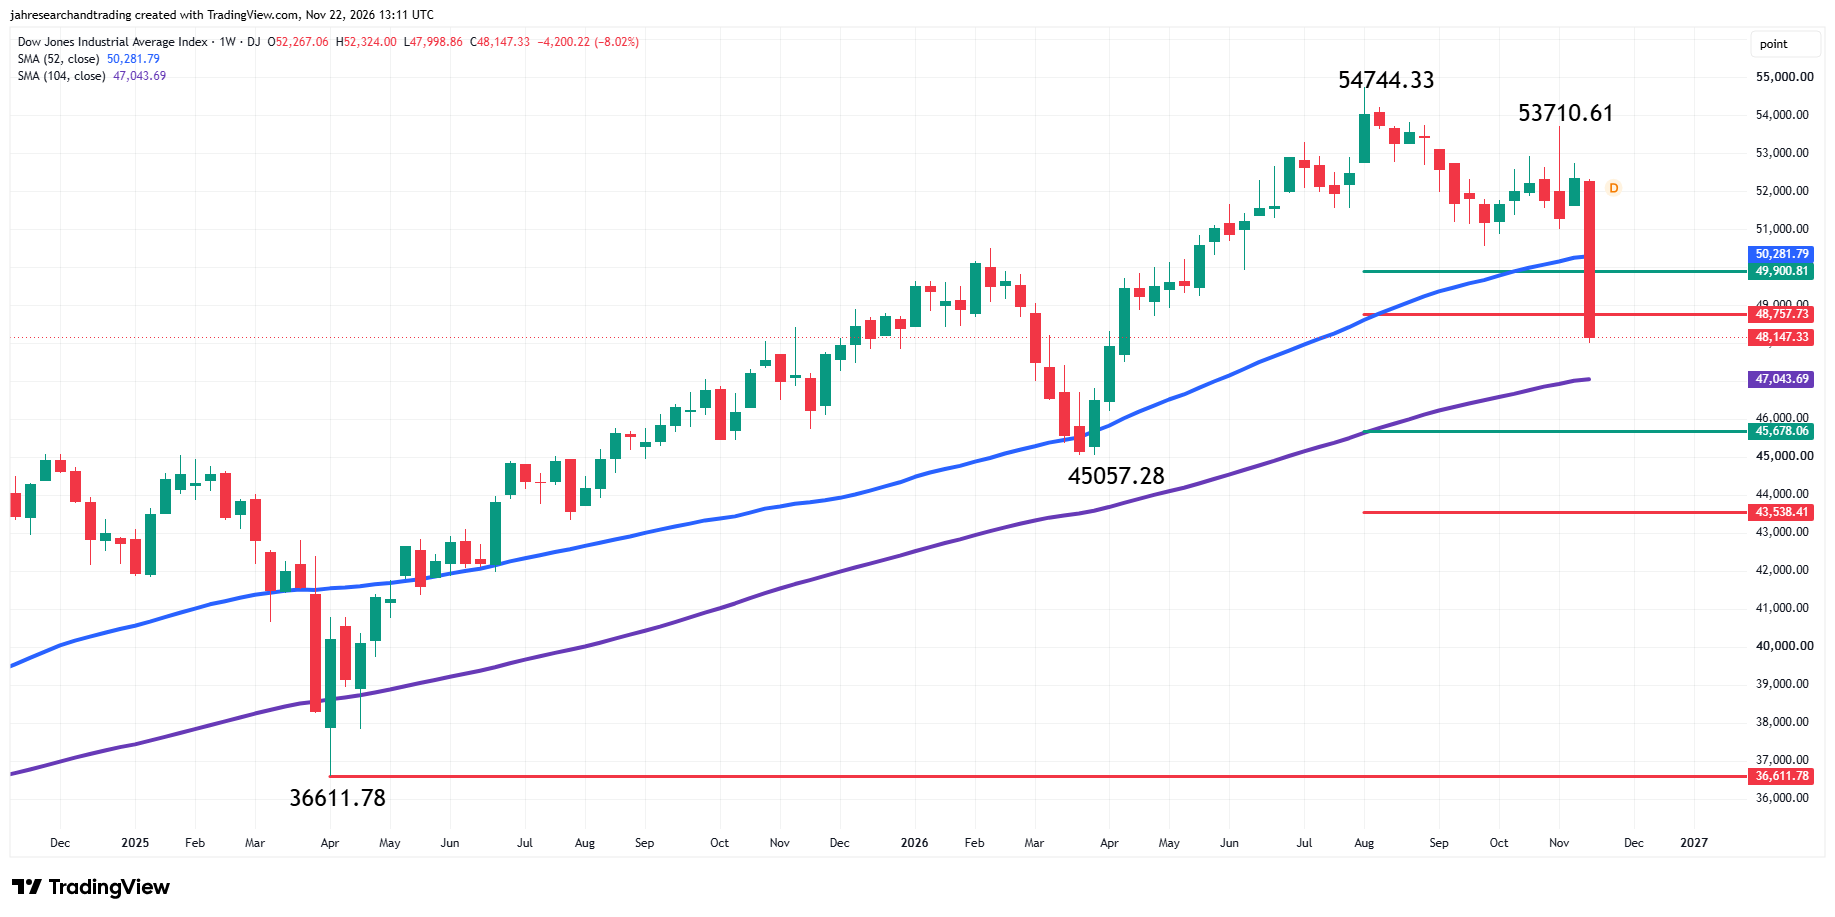
Dow Jones: 48,147.33 (-8.02%). Support: 47,043.69 (104-week SMA), 45,678.06, 45057.28, 43,538.41 and 36611.78; Resistance: 48,757.73, 49,900.81, 50,281.79 (52-Week SMA), 53710.61 and 54744.33.
Weekly Nasdaq Composite Index
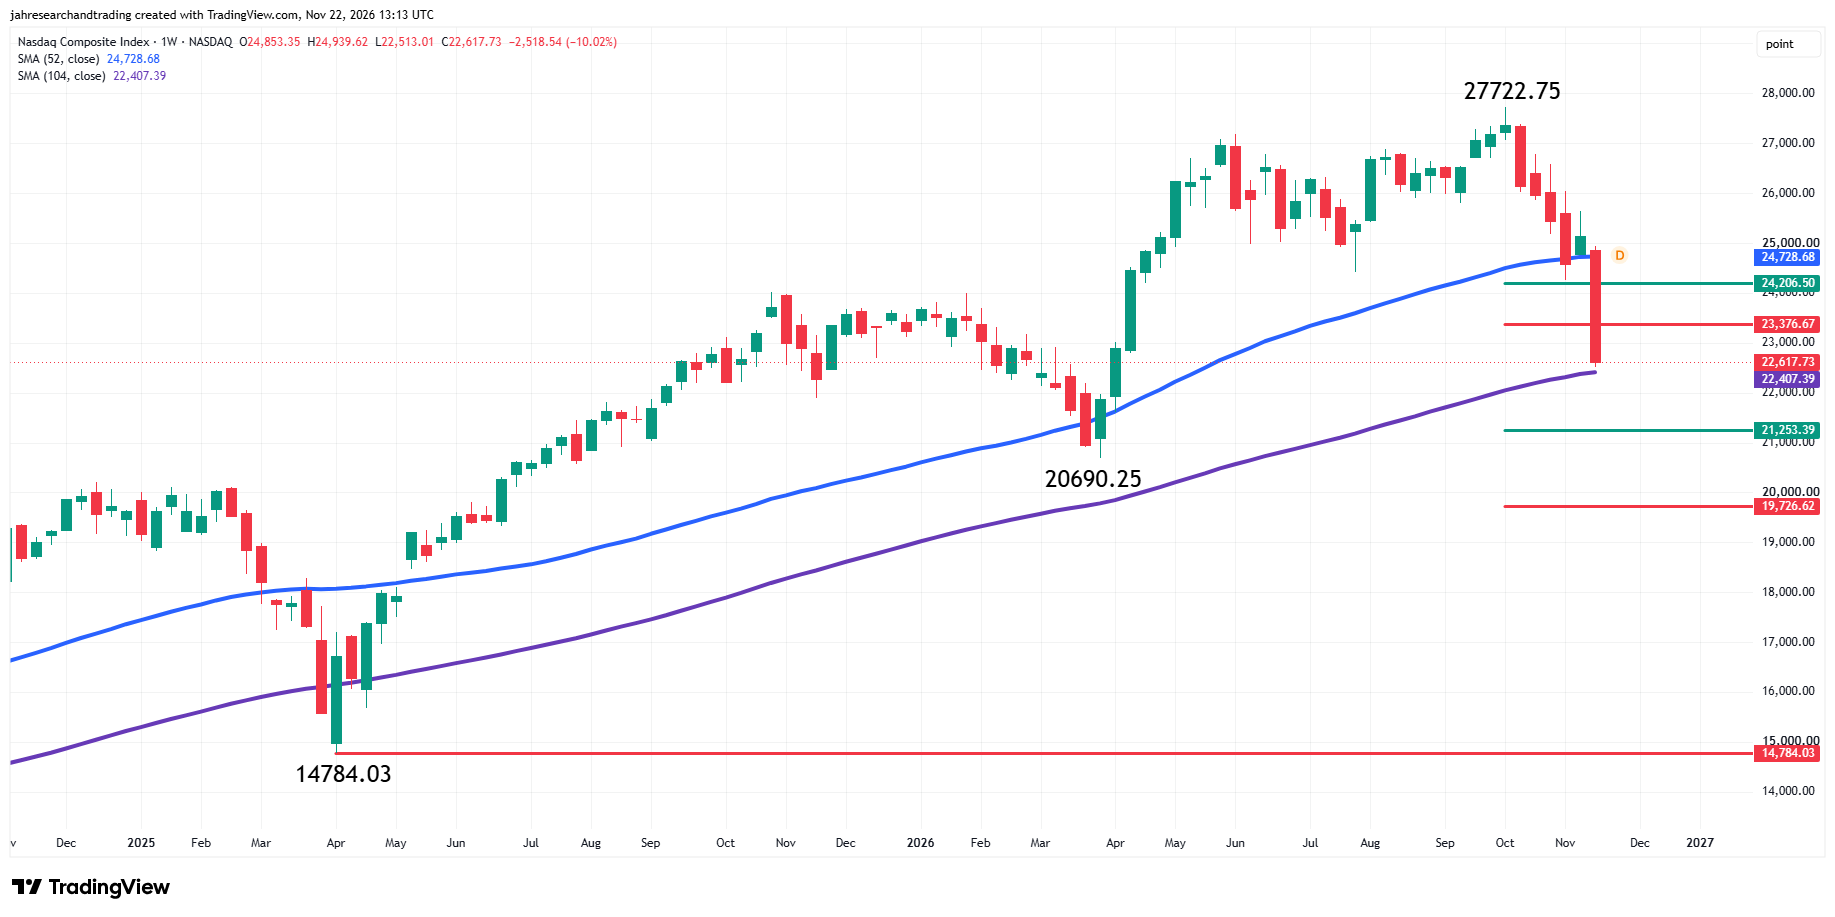
Nasdaq: 22,617.73 (-10.02%). Support: 22,407.39 (104-week SMA), 21,253.39, 20690.25, 19,726.62 and 14,784.03; Resistance: 23,376.67, 24,206.50, 24,728.68 (52-week SMA) and 27722.75.
Weekly S&P 500 Index
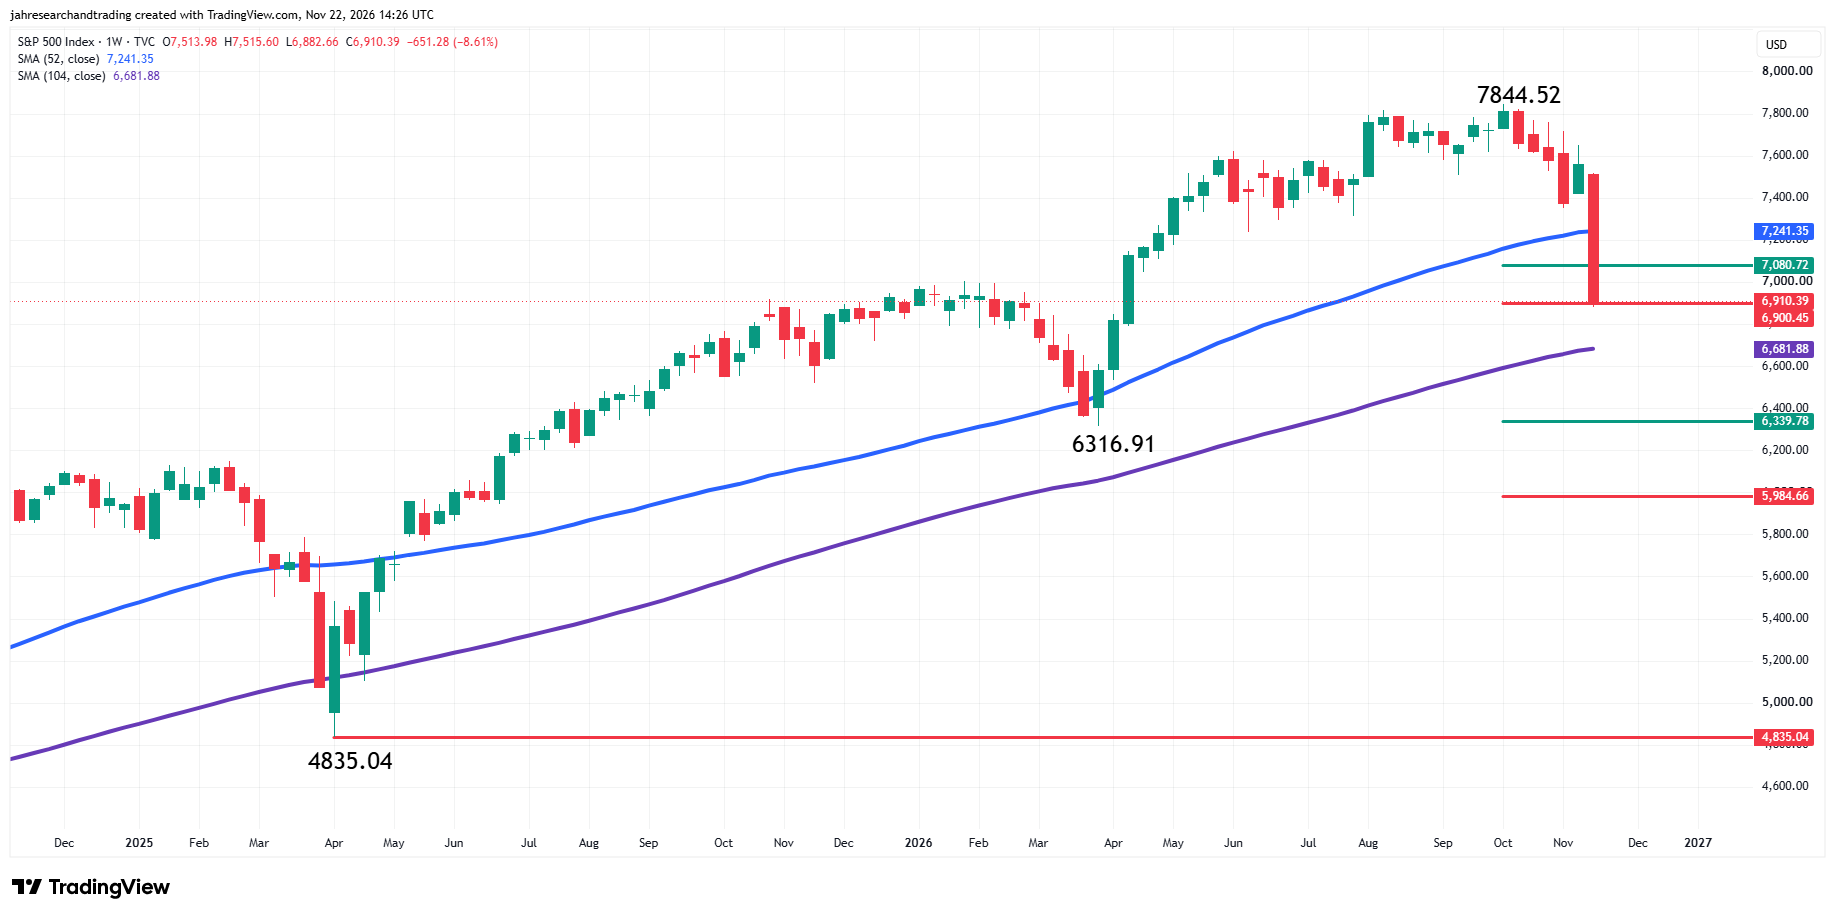
S&P 500: 6,910.39 (-8.61%). Support: 6,900.45, 6,681.88 (104-week SMA), 6,339.78, 6316.91, 5,984.66 and 4,835.04; Resistance: 7,080.72, 7,241.35 (52-week SMA) and 7844.52.
All three indexes closed below their 52-week SMAs.
Weekly Outlook
Wednesday’s PCE report is the main economic event in a week shortened by Thanksgiving. Traders will also get an updated reading on third-quarter GDP, along with unemployment claims, personal income and spending. Tuesday’s consumer confidence report and the start of the holiday shopping season will provide more information on the consumer. On the earnings front, results from Analog Devices and Dell could influence the AI and technology trade, while Deere’s guidance will give investors a look at the farm equipment market.
The sharp decline in stocks has raised the possibility of a near-term technical bounce. But further forced selling could put the market under pressure before buyers have a chance to respond. All three indexes closed below their 52-week moving averages, leaving those levels as resistance. Traders will be watching whether the Dow and Nasdaq can hold above their 104-week moving averages and whether the S&P 500 can hold 6,900.00. A recovery of the 52-week averages would improve the outlook, while a break through nearby support could extend the decline.
More Information in our Economic Calendar.