



Dollar Heads for Best Week Since September as Fed Hawks Dominate
The dollar held near a 19-month high on Friday and was on track for its biggest weekly gain since September, Reuters reported. The dollar index, which tracks the greenback against six major currencies, stood at 103.18, near its highest since April 2025, while the yen held near the 160-per-dollar level it briefly touched on Thursday.
Dollar: Williams Joins the Hawks
New York Fed President John Williams said on Thursday that more rate hikes are likely, Reuters reported. The two-year Treasury yield, which tends to move with rate expectations, has risen 34 basis points, or 0.34 percentage point, over two sessions, its sharpest two-day rise in three and a half years. Traders see a 14.5% chance of a larger, half-point Fed hike next month, up from zero last week, according to CME’s FedWatch tool, which turns futures prices into rate odds.
“Hawkish Fed repricing has widened the US rate advantage,” MUFG analysts wrote. Japan spent 15.4tn yen to support its currency after it sank to 163.99 per dollar in late July, Reuters noted. US producer price data are due at 13:30 GMT, according to the BLS schedule.
Euro: Squeezed by the Rate Gap
The euro traded near $1.1059, just above its lowest level against the dollar since April 2025, and was on track for its largest weekly loss since late September, Reuters said. ECB Chief Economist Philip Lane has said a December hike would be “prudent” if the information the ECB has then is the same as now, with euro zone inflation at 4%.
That has not been enough. In my view, the euro is trading the gap between the two central banks, and the Fed’s hike path is now being priced faster and further than the ECB’s.
EUR/USD Price Forecast
Every new EUR/USD analysis as it publishes, today's technical signal and key levels, live price — on one page.
See all EUR/USD forecastsPound: Strong Growth, Little Lift
Britain’s economy grew 0.7% in the third quarter, in line with forecasts and its fastest pace in about two and a half years, the Office for National Statistics said. Services rose 0.9%, and computer programming and consultancy grew 4.4%. The ONS said there was “widespread strength in industries which may be related to artificial intelligence,” Reuters reported. Business investment rose only 0.4%. The Bank of England now expects 1.6% growth this year, above the Office for Budget Responsibility’s 1.2% forecast, Reuters said.
“The GDP numbers were good news … they show you there’s good momentum in AI roll-out and services in the UK economy,” said Kenneth Broux, FX and rates strategist at Societe Generale. Even so, the figures had little immediate impact on sterling, which was down 0.06% at $1.3271, Reuters reported. In my view, strong growth would normally lift a currency, but the dollar’s widening rate advantage is outweighing it for now.
US Dollar Index Technical Analysis: DXY Stalls Below 103.23 as 102.88 Support Holds
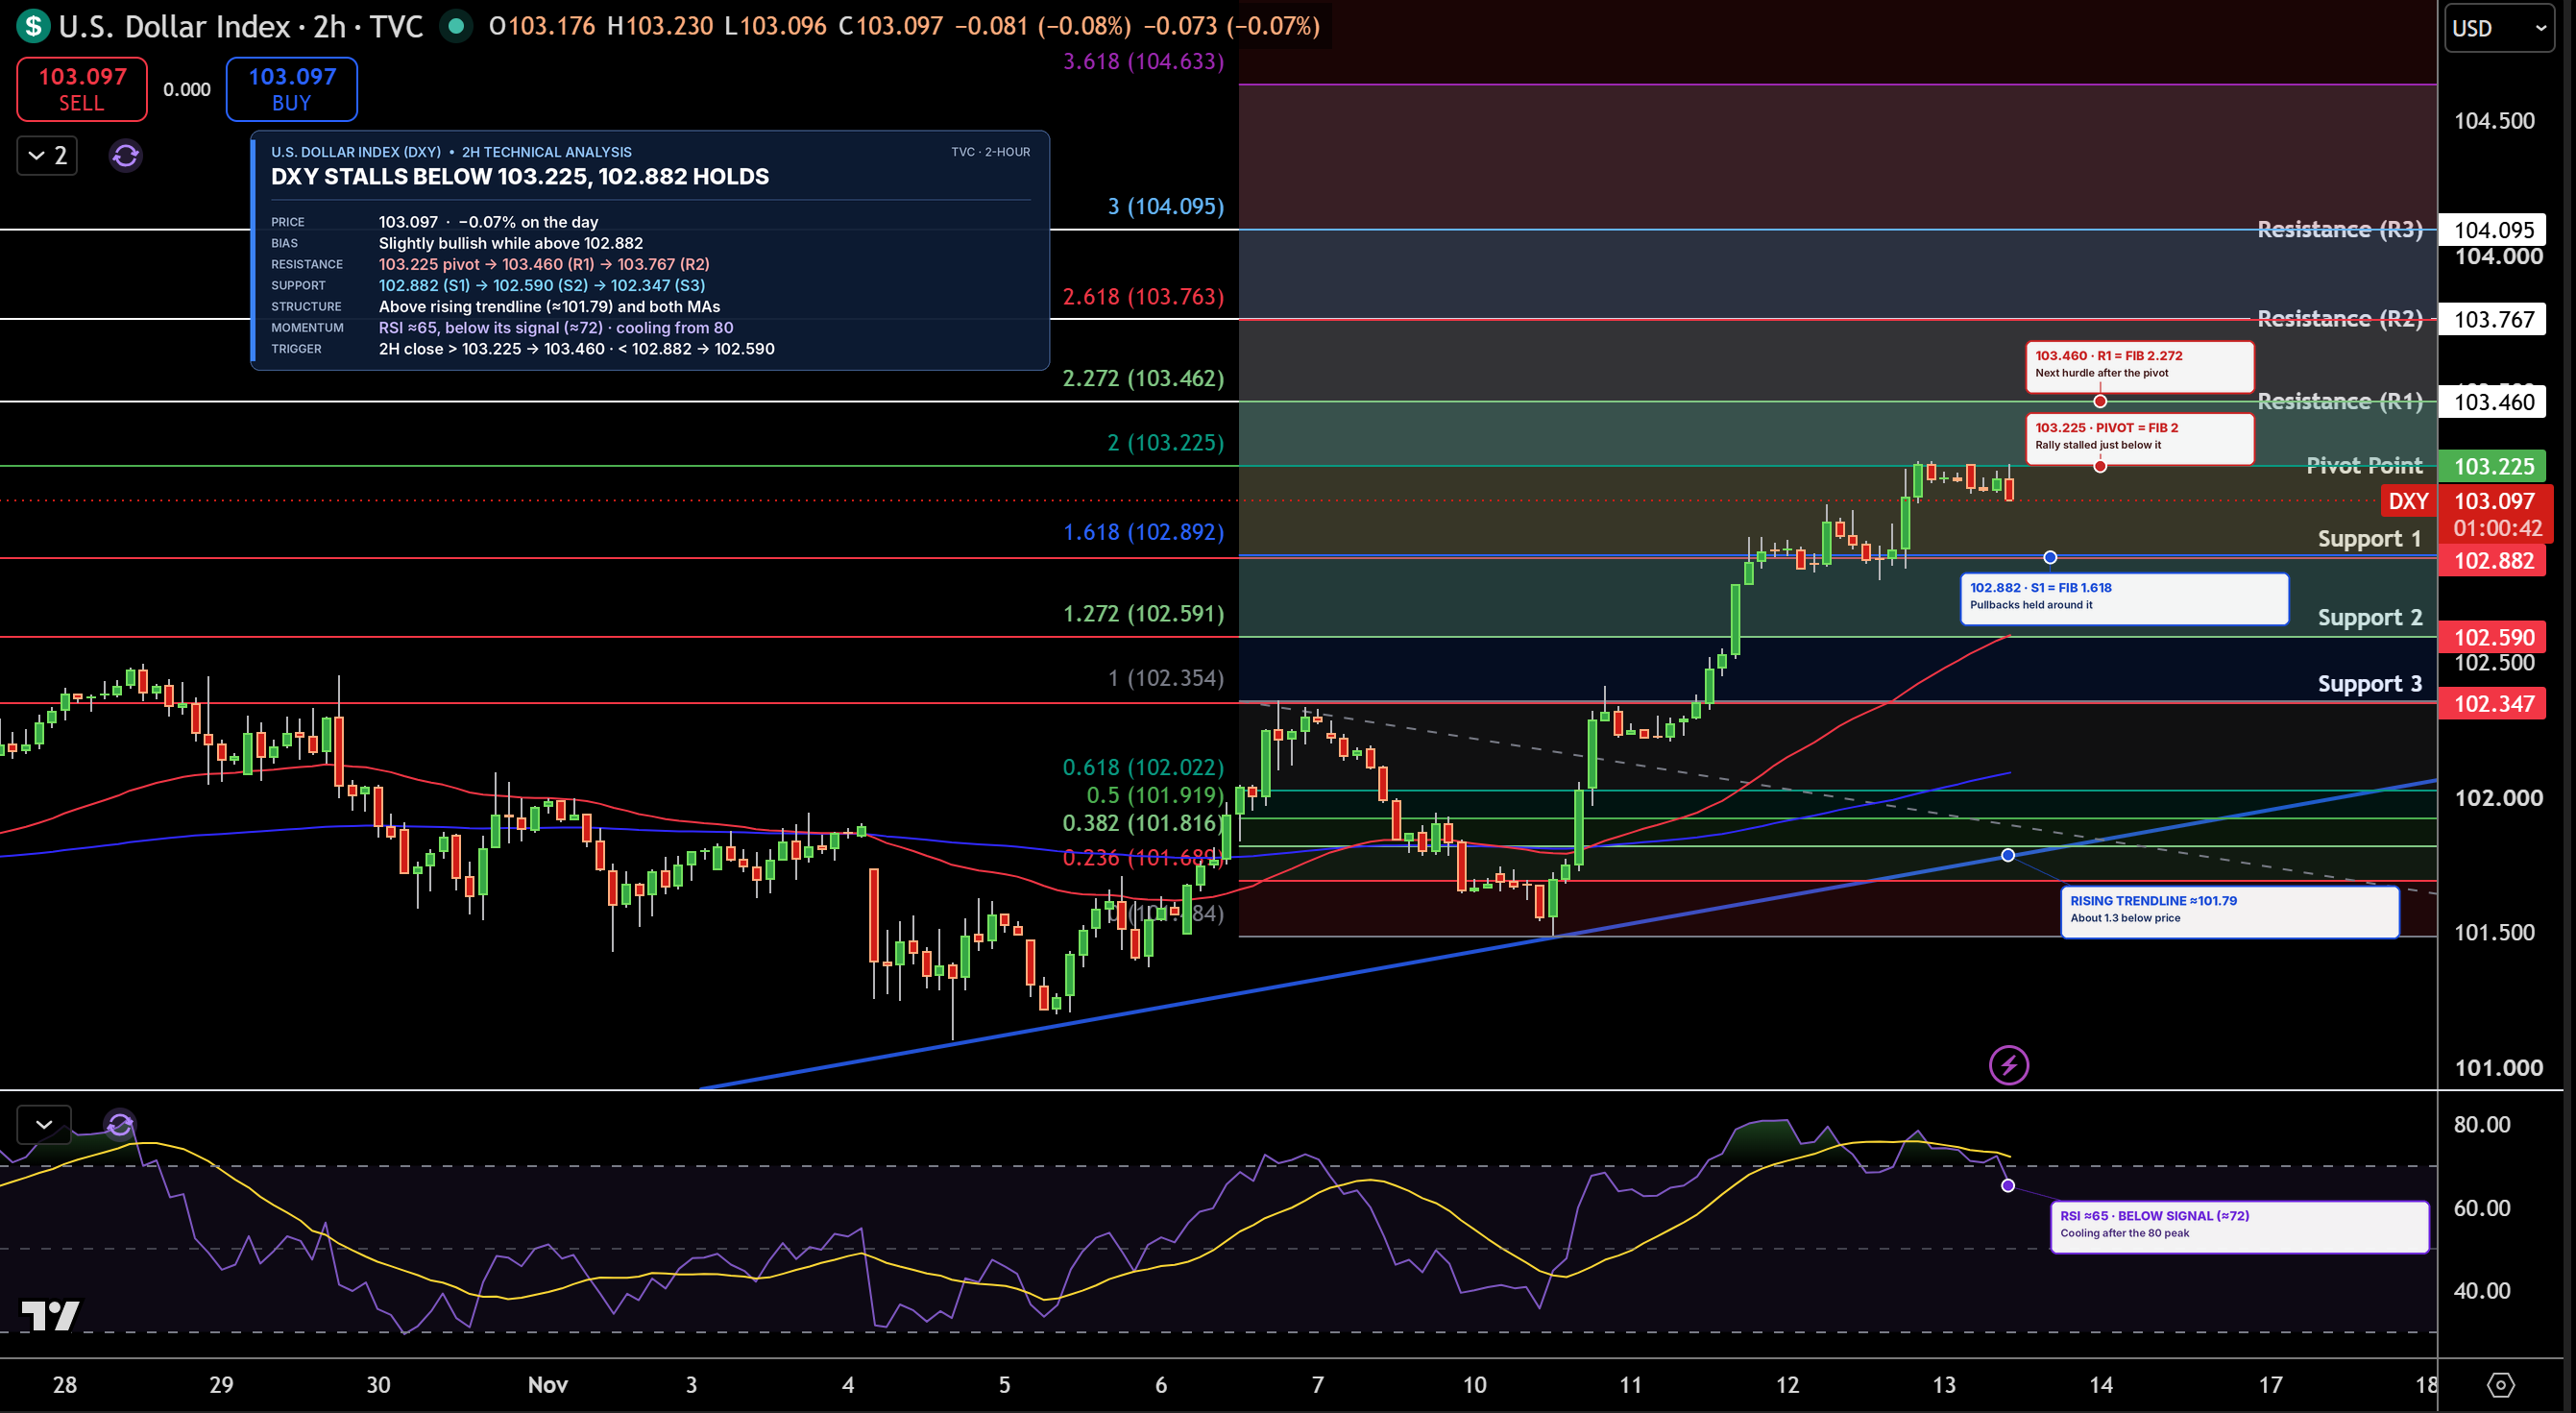
The US Dollar Index is trading near 103.10 on the 2-hour chart. The rally has paused just below 103.23, the pivot point, a level calculated from the previous period’s high, low and close that traders use to judge direction. DXY is still above both moving averages, which track average prices over time, and a rising trendline, a line connecting higher lows since early November.
Resistance, where sellers may return, is 103.23, then 103.46. Support, where buyers may step in, is 102.88, then 102.59. RSI, a 0 to 100 gauge of buying and selling strength, has cooled to about 65 from overbought and slipped below its signal line, a slower average of RSI. I lean slightly bullish while DXY holds 102.88. A close above 103.23 would open 103.46.
EUR/USD Technical Analysis: Euro Bounces From 1.1056 but Stays Below 1.1098
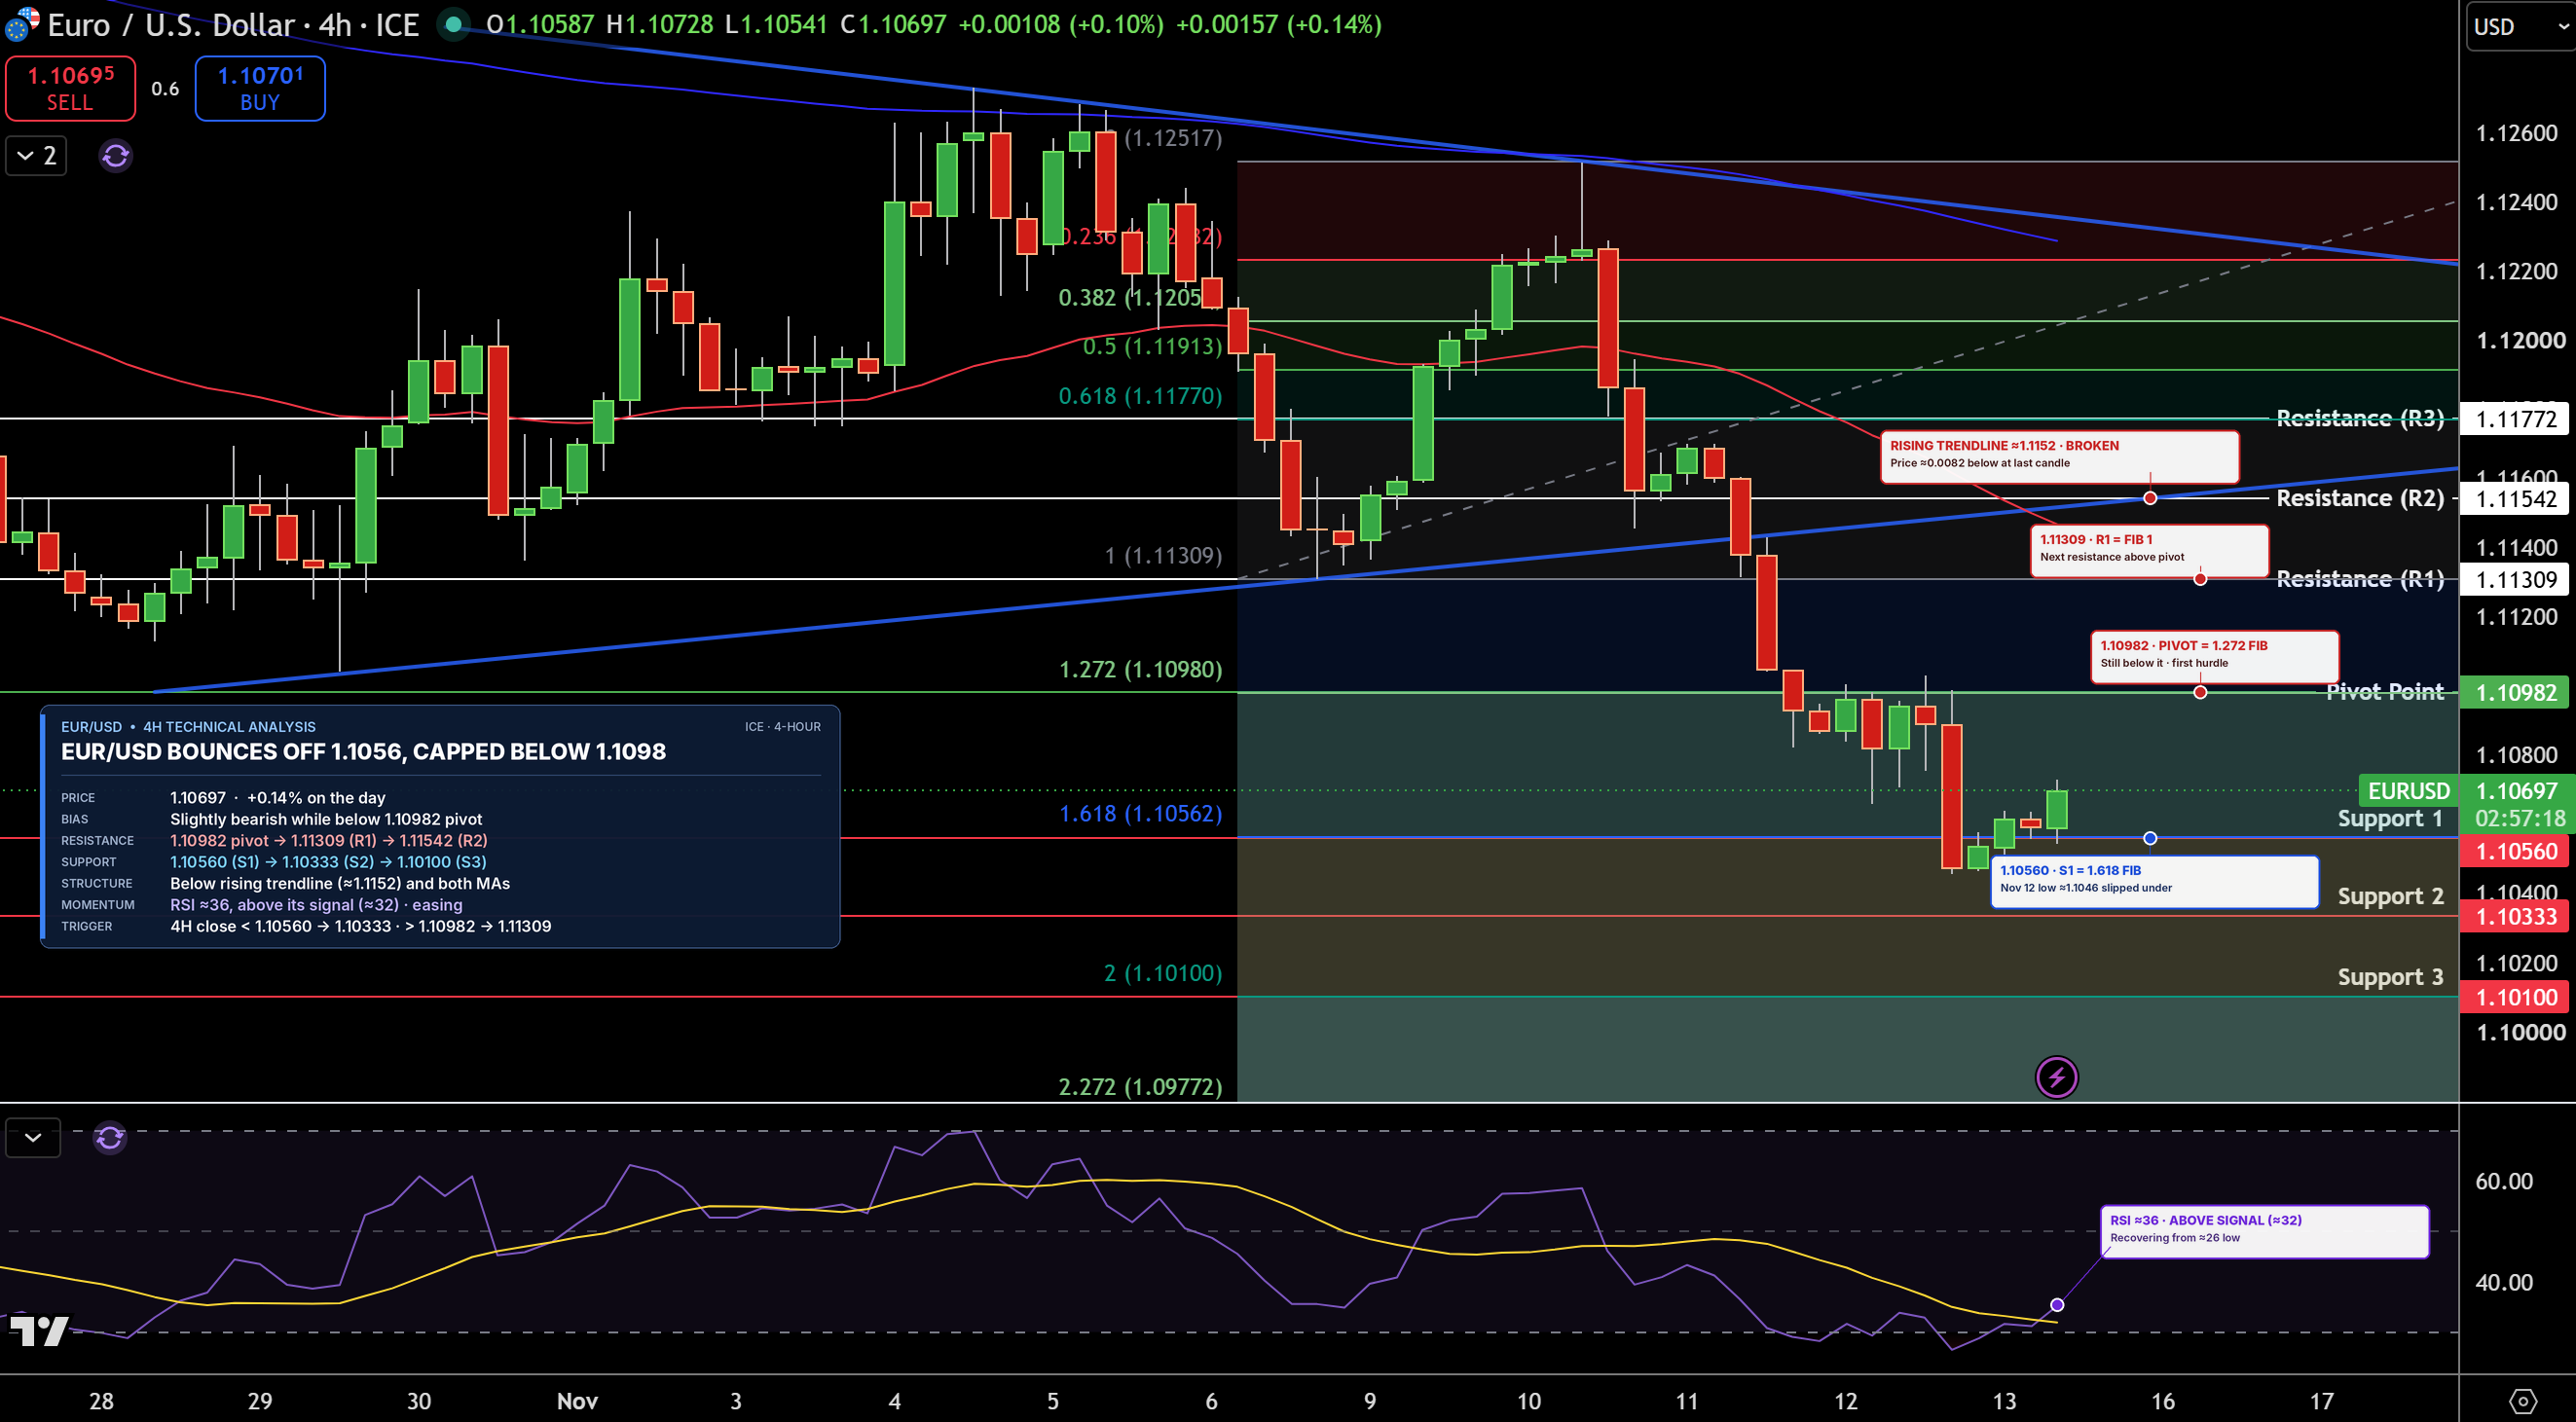
EUR/USD is trading near 1.1070 on the 4-hour chart. Buyers stepped in near 1.1056, a Fibonacci extension level, which projects how far a move may stretch. The pair is still below its 1.1098 pivot, its broken rising trendline and both moving averages.
Resistance is 1.1098, then 1.1131. Support is 1.1056, then 1.1033. RSI has recovered to about 36 and moved above its signal line, so selling is easing. The euro keeps a slight bearish lean while it stays below 1.1098, and a close below 1.1056 would open 1.1033.
GBP/USD Technical Analysis: Pound Tests 1.3243 Pivot Zone as 1.3200 Comes Into Focus
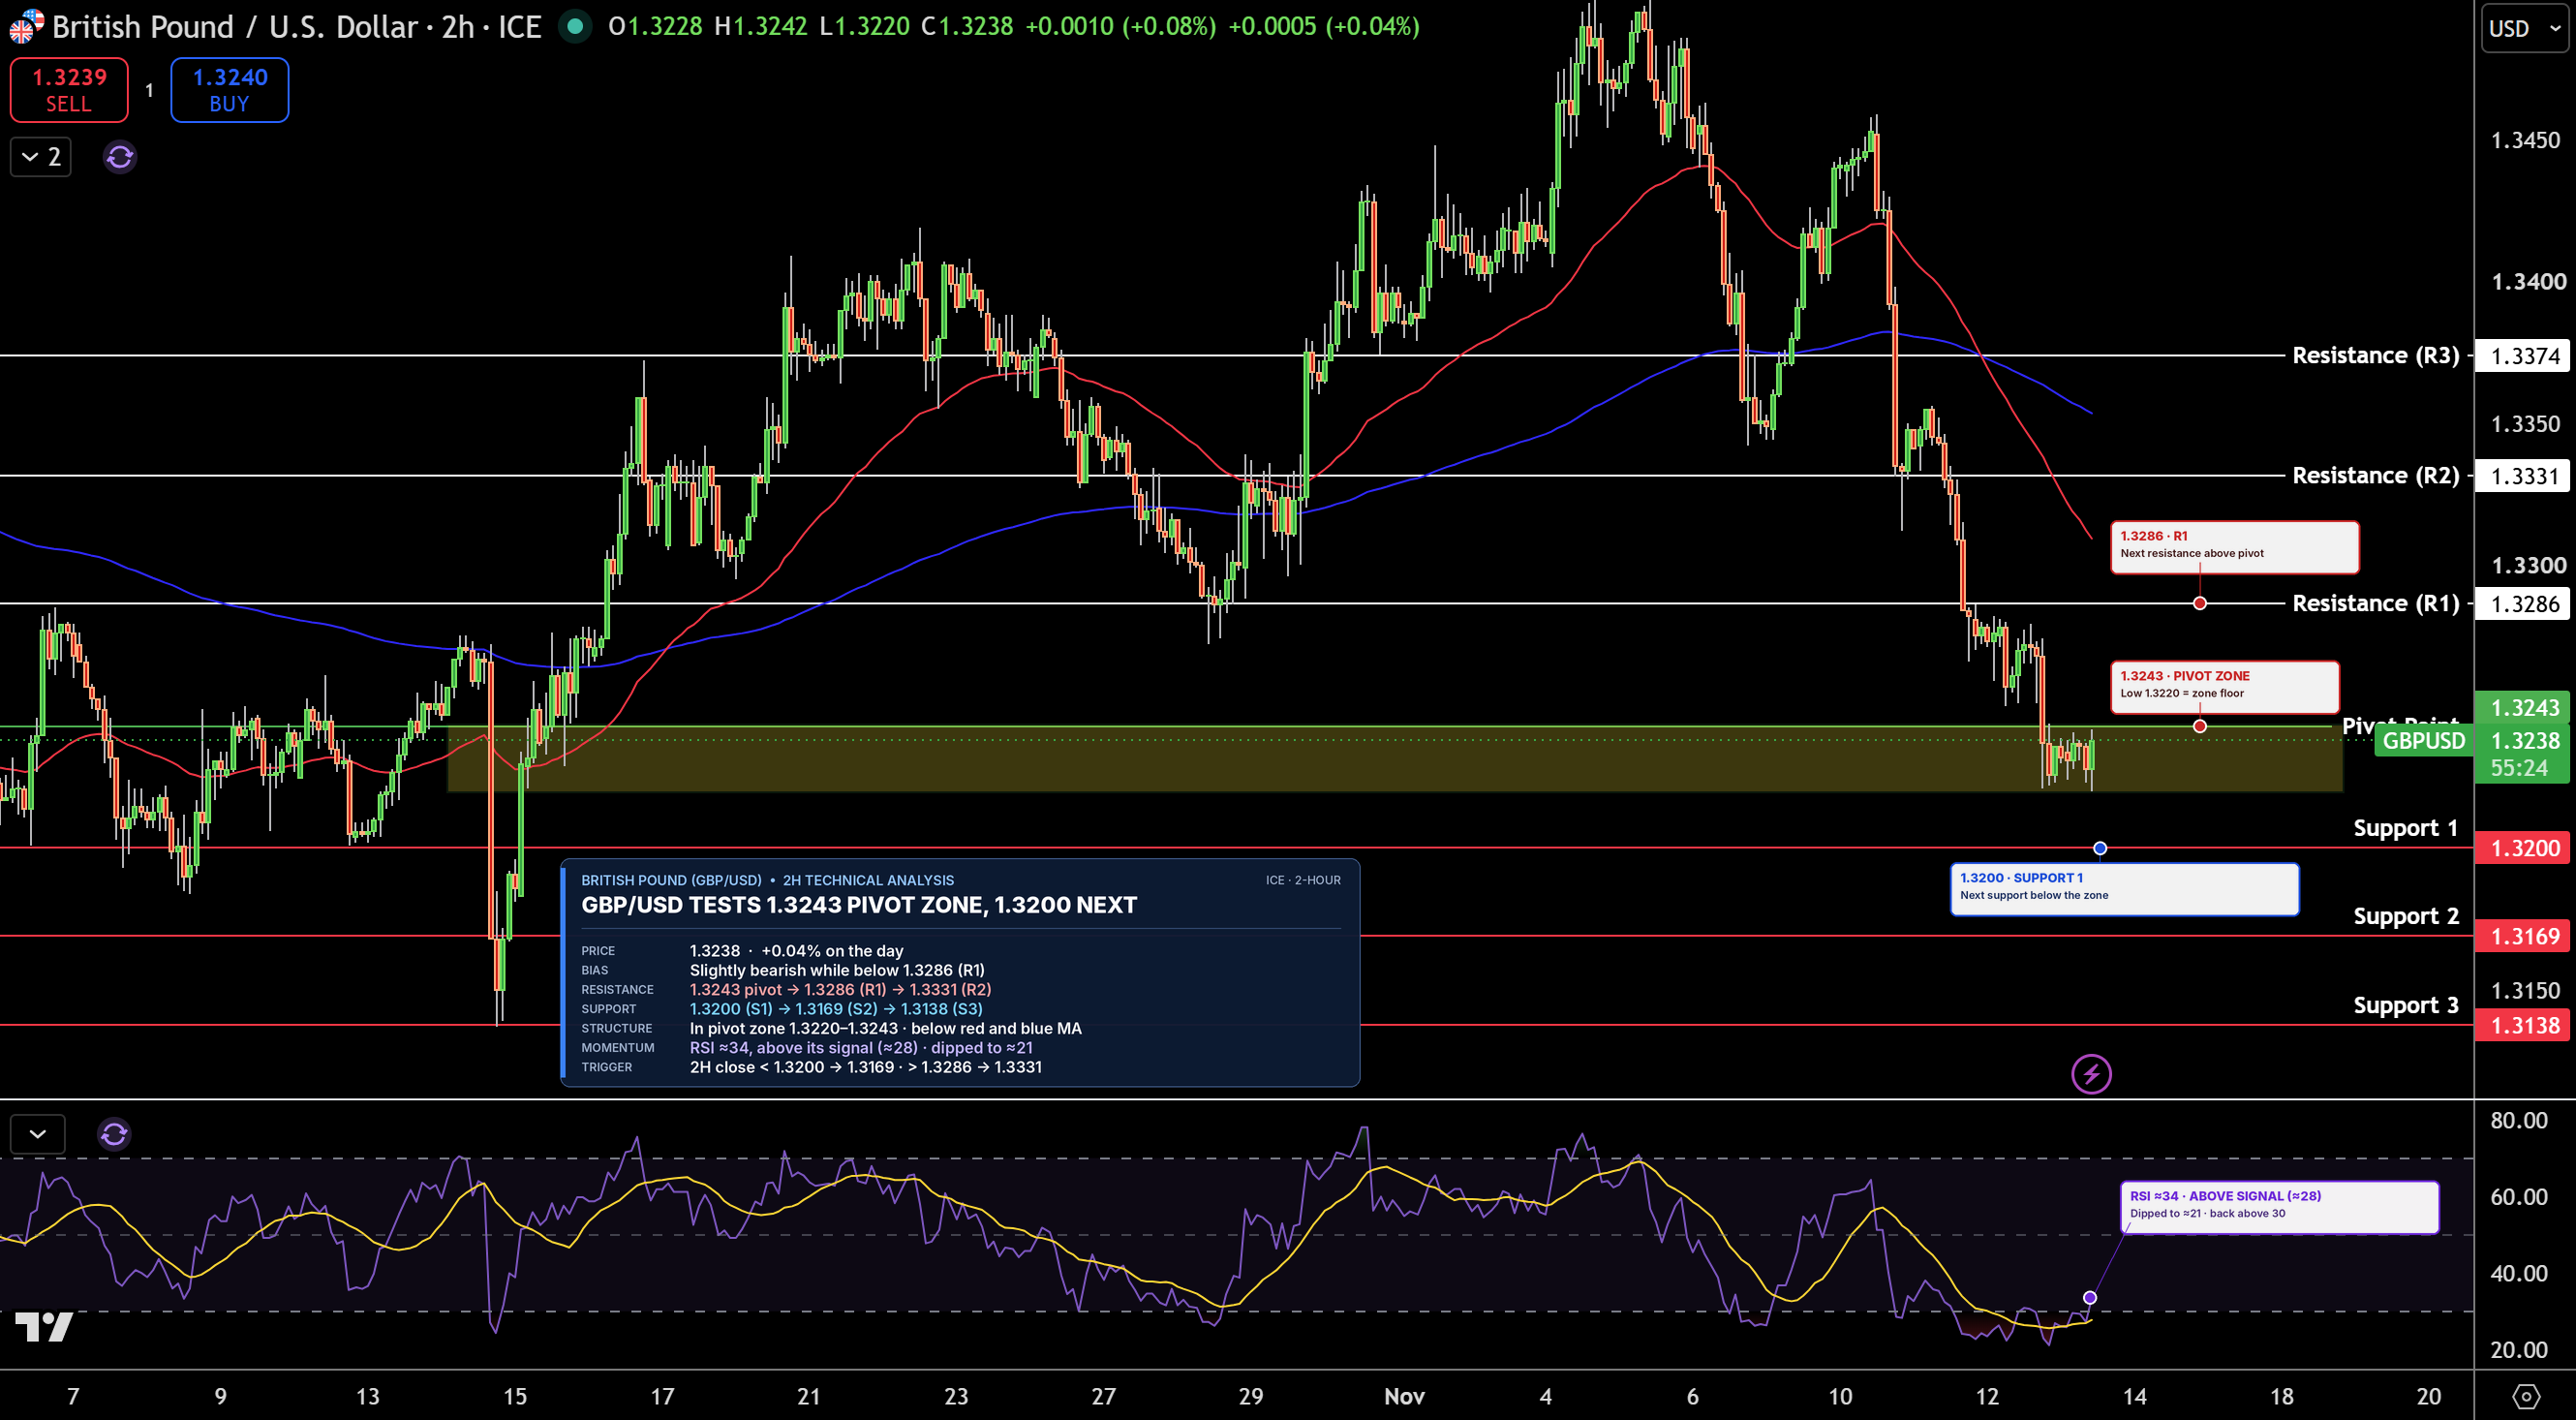
GBP/USD is trading near 1.3238 on the 2-hour chart after sliding into its 1.3220 to 1.3243 pivot zone. The pound remains below both moving averages.
Support is 1.3200, then 1.3169. Resistance is 1.3243, then 1.3286. RSI is near 34 and turning up from oversold, meaning prices fell very fast. The pound holds a slight bearish lean below 1.3286, and a close below 1.3200 would open 1.3169.