



US Dollar News: Fed Decision Takes Center Stage as Euro and Pound Face Domestic Risks
The US dollar enters October 28 with monetary policy firmly in focus as the Federal Reserve concludes its two-day meeting later Wednesday. CME FedWatch showed about a 91% probability of no change in the target range ahead of the decision, shifting attention toward Chair Kevin Warsh’s guidance on December. US business-equipment data were firm: September orders for nondefense capital goods excluding aircraft rose 0.5%, while shipments in that category increased 1.2%, according to the Census Bureau’s advance report. The 10-year Treasury yield stood at 5.00% on October 26, keeping long-term borrowing costs elevated and potentially supporting the dollar.
The euro faces a more complicated setup ahead of the European Central Bank’s October 29 decision. The ECB has raised rates twice in 2026, most recently in September, taking the deposit rate to 2.50%. The September decision cited the Middle East conflict as a source of inflation pressure. France adds a separate growth and funding risk: its 10-year TEC 10 yield rose to 5.13% on October 22 before easing to 4.94% on October 27. The Banque de France has warned that fiscal and political uncertainty could intensify as the 2027 budget and elections approach. The ECB’s third-quarter bank-lending survey also recorded tighter loan terms in France. These pressures complicate the policy trade-off: the energy shock raises inflation risk, while higher financing costs and tighter credit may weigh on demand.
Sterling’s fundamentals are being shaped by Britain’s Budget on October 28 and the Bank of England’s next decision on November 5. September CPI inflation accelerated to 3.5% year over year from 3.1% in August, while services inflation rose to 3.7%. ONS data show public-sector net debt reached £3,005 billion at the end of September, moving above £3 trillion for the first time. At the September MPC meeting, six members voted to hold Bank Rate at 3.75%, while three backed a 25-basis-point increase to 4.00%. The next policy decision is scheduled for November 5.
Chancellor John Healey is due to present Budget 2026 later Wednesday. Ahead of the statement, markets will focus on the balance between energy-cost support, revenue measures and borrowing, as changes to the fiscal outlook could affect sterling and gilt prices.
For October 28, the FX theme is monetary policy and fiscal risk: the dollar awaits Warsh’s decision-day guidance, the euro weighs energy-driven inflation against French borrowing costs and tighter credit, while sterling faces today’s Budget ahead of the Bank of England’s November 5 meeting.
US Dollar Index Technical Analysis: DXY Holds Above 102.03 as 102.59 Becomes the Next Breakout Test
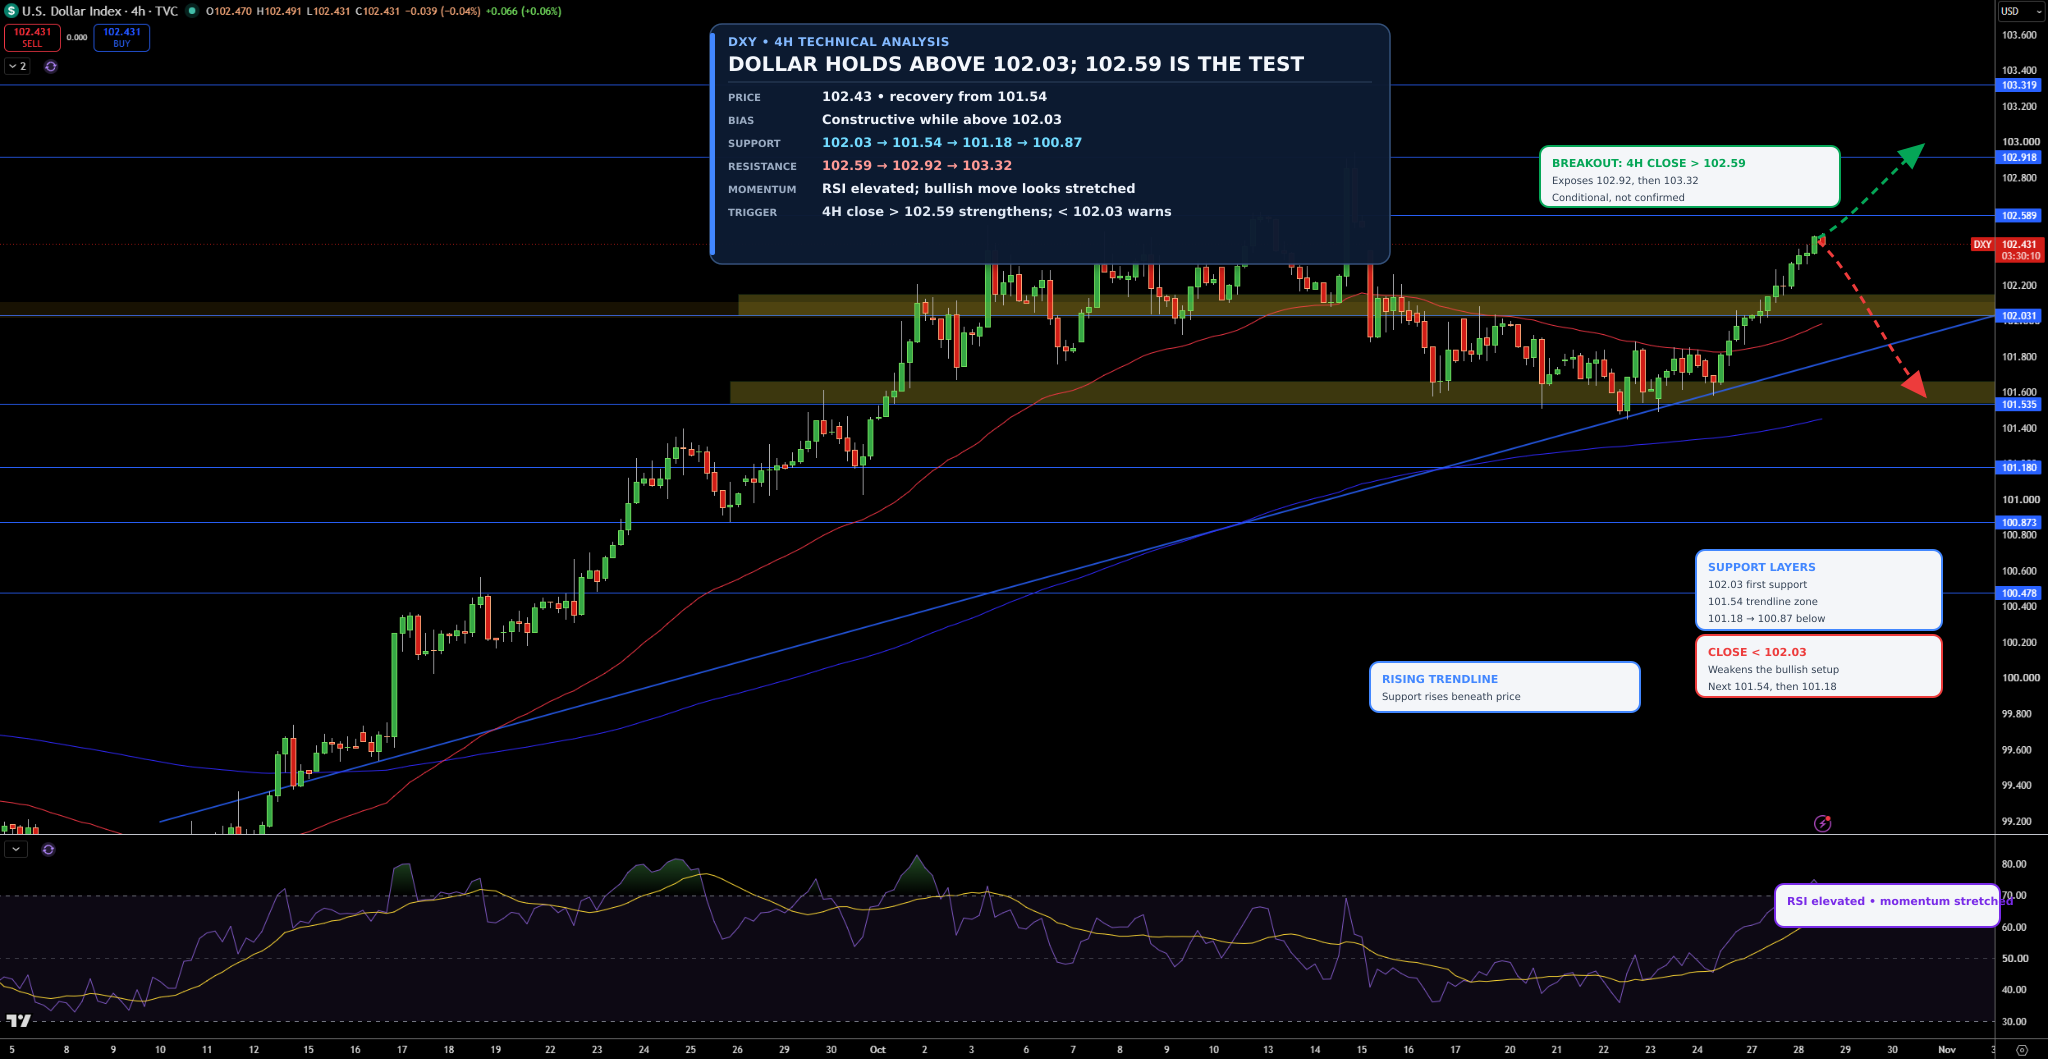
The US Dollar Index is trading near 102.43 on the 4-hour chart after extending its recovery from the 101.54 support area. What stands out to me is that price has reclaimed the short-term moving average and continues to hold above the rising trendline, keeping the broader structure constructive. The recent sequence of higher lows also suggests buyers remain in control, although DXY is now approaching another important resistance area.
The first resistance I am watching is 102.59. A clean break above that level would expose 102.92, followed by 103.32. On the downside, 102.03 is the first important support, with 101.54, 101.18, and 100.87 becoming more relevant if sellers regain control.
RSI is trading in the upper portion of its range, confirming strong bullish momentum but also suggesting the move is becoming somewhat stretched. I am leaning bullish while DXY remains above 102.03 and the rising trendline. A sustained break above 102.59 would strengthen the case for 102.92, while a move below 102.03 would weaken the immediate bullish setup.
EUR/USD Price Forecast
Every new EUR/USD analysis as it publishes, today's technical signal and key levels, live price — on one page.
See all EUR/USD forecastsEUR/USD Technical Analysis: EUR/USD Tests 1.1113 Support as Bearish Momentum Remains Intact
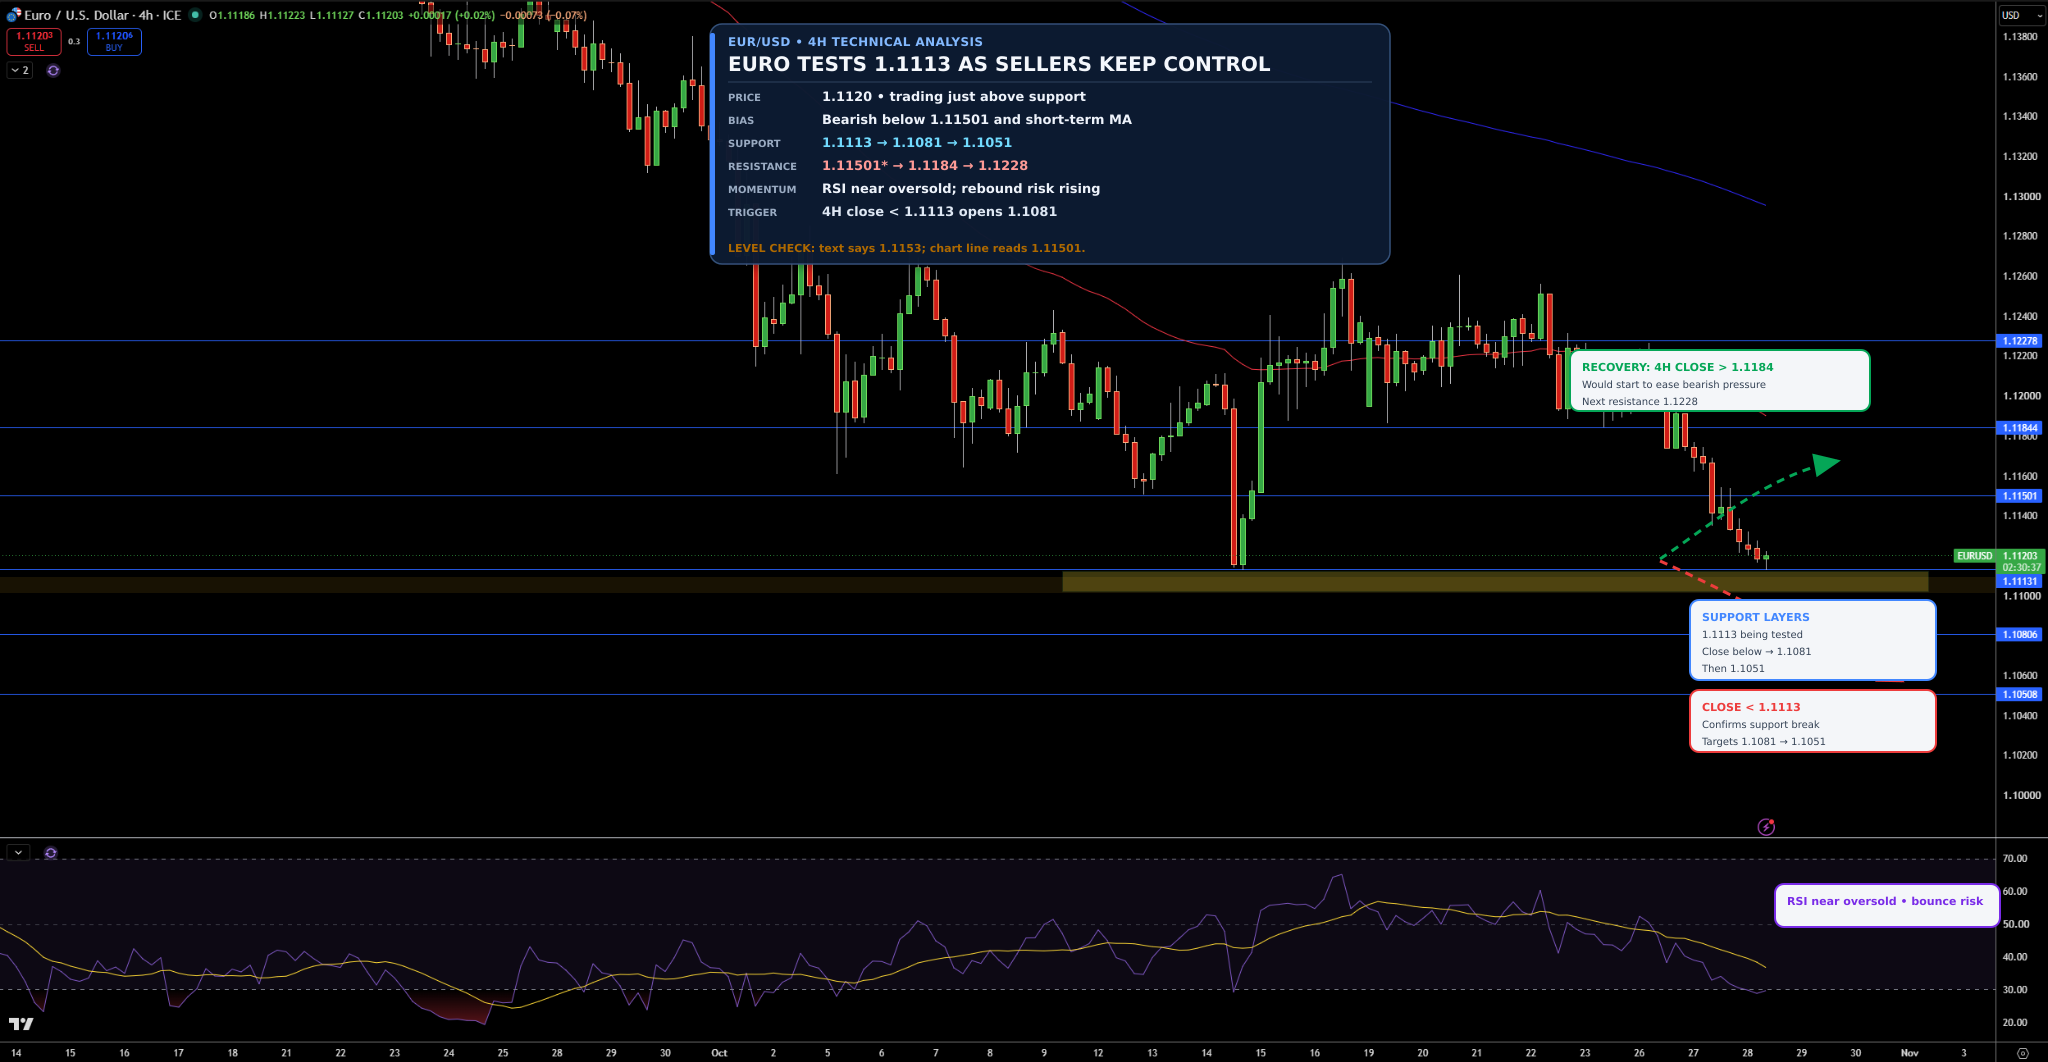
EUR/USD is trading near 1.1120 on the 4-hour chart after extending its decline below the 1.1150 support level. What catches my attention is that price remains firmly below both moving averages, while the broader sequence of lower highs and lower lows continues to favor sellers. The pair is now trading directly above the 1.1113 support area, making this level important for the next move.
The first support I am watching is 1.1113. A clean break below that level would expose 1.1081, followed by 1.1051. On the upside, 1.1150 is now the first resistance, with 1.1184 and 1.1228 becoming more relevant if buyers manage a recovery.
RSI is hovering near oversold territory, which confirms strong downside pressure but also increases the risk of a corrective rebound. I am leaning bearish while EUR/USD remains below 1.1150 and the short-term moving average. A sustained break below 1.1113 would strengthen the case for 1.1081, while a recovery above 1.1184 would start to ease the bearish pressure.
GBP/USD Technical Analysis: GBP/USD Breaks Below 1.3307 as 1.3245 Support Comes Into Focus
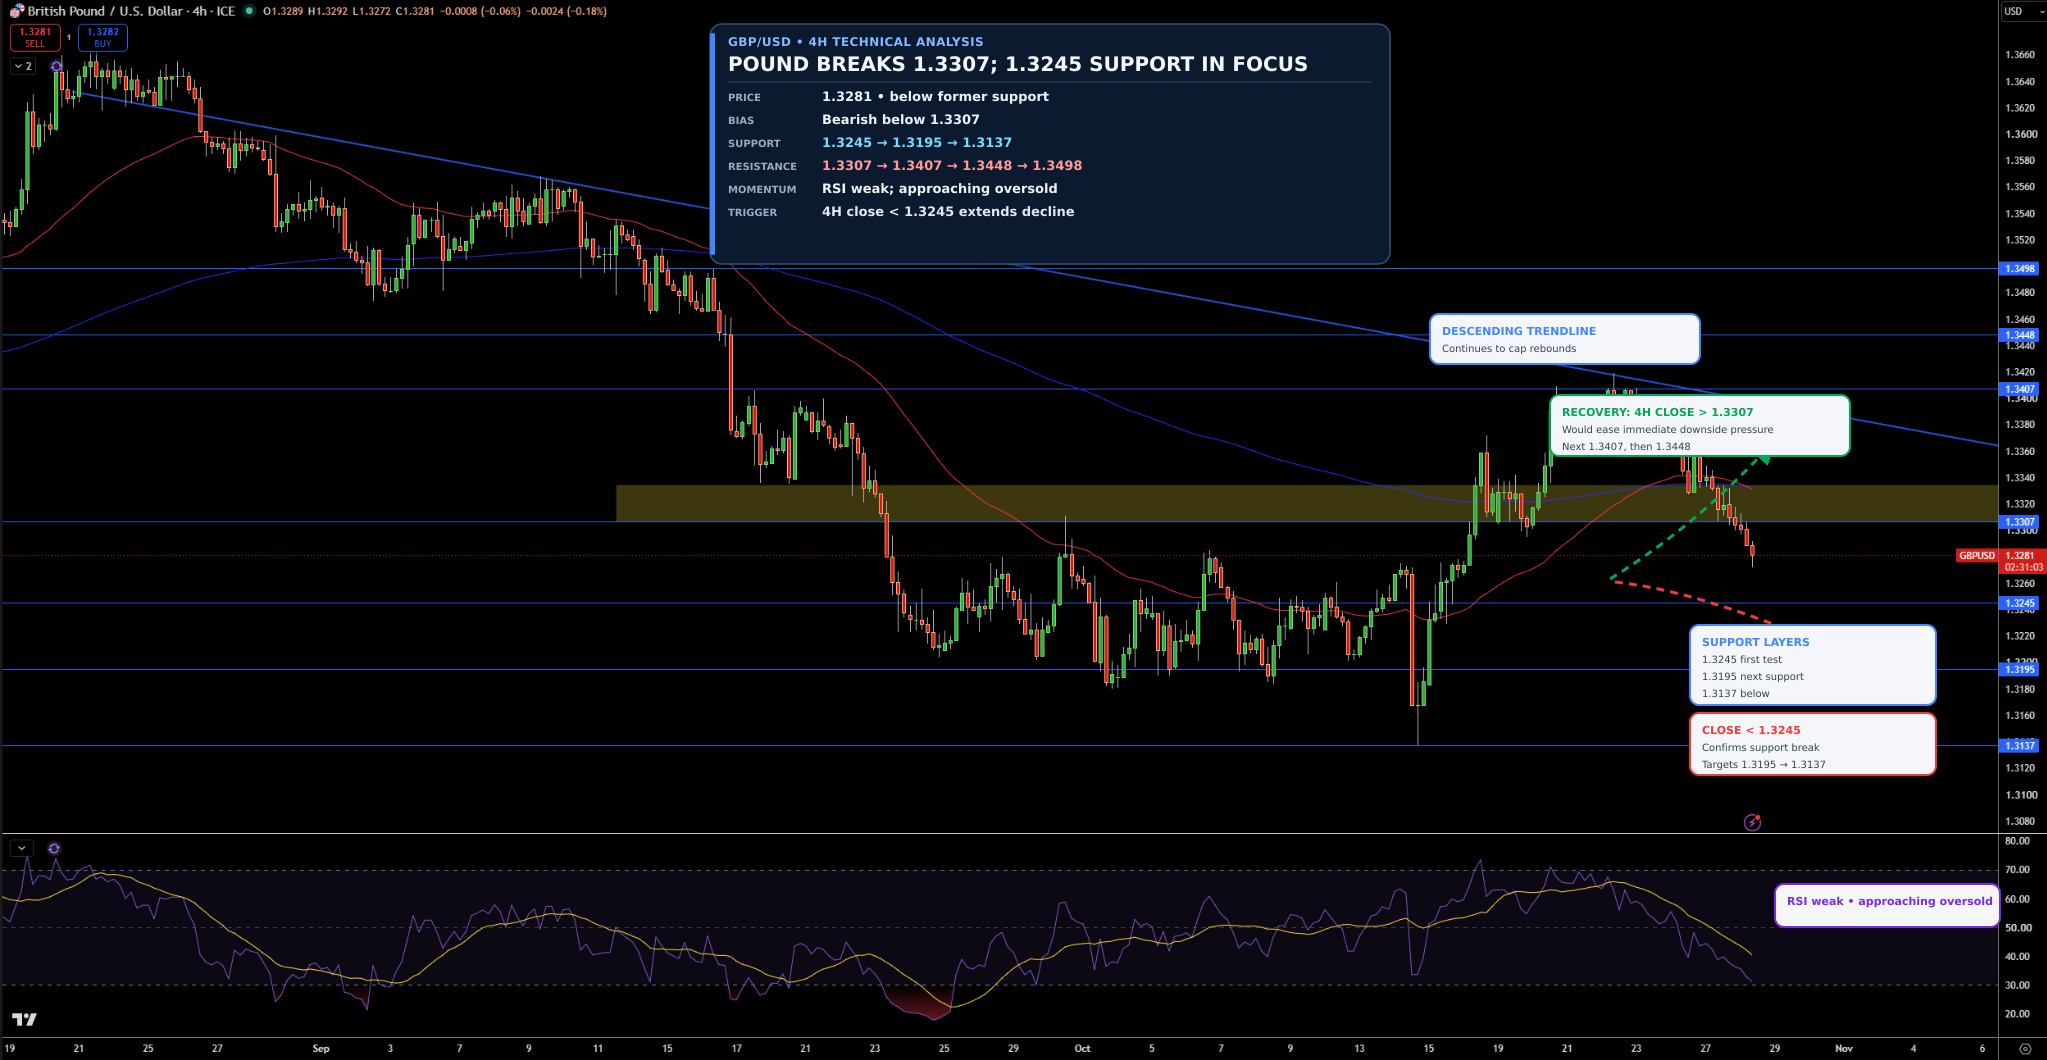
GBP/USD is trading near 1.3281 on the 4-hour chart after extending its decline below the 1.3307 support area. What stands out to me is that price has also slipped beneath the short-term moving average, while the broader descending trendline and longer-term moving average continue to cap the upside. That keeps the overall structure bearish despite the earlier recovery from the October lows.
The first support I am watching is 1.3245. A clean break below that level would expose 1.3195, followed by 1.3137. On the upside, 1.3307 is now the first resistance, with 1.3407, 1.3448, and 1.3498 becoming more relevant if buyers regain control.
RSI has dropped into the lower end of its range, which tells me bearish momentum is strengthening and approaching oversold conditions. I am leaning bearish while GBP/USD remains below 1.3307 and the descending trendline. A sustained break below 1.3245 would strengthen the case for 1.3195, while a recovery above 1.3307 would ease the immediate downside pressure.