


WTI
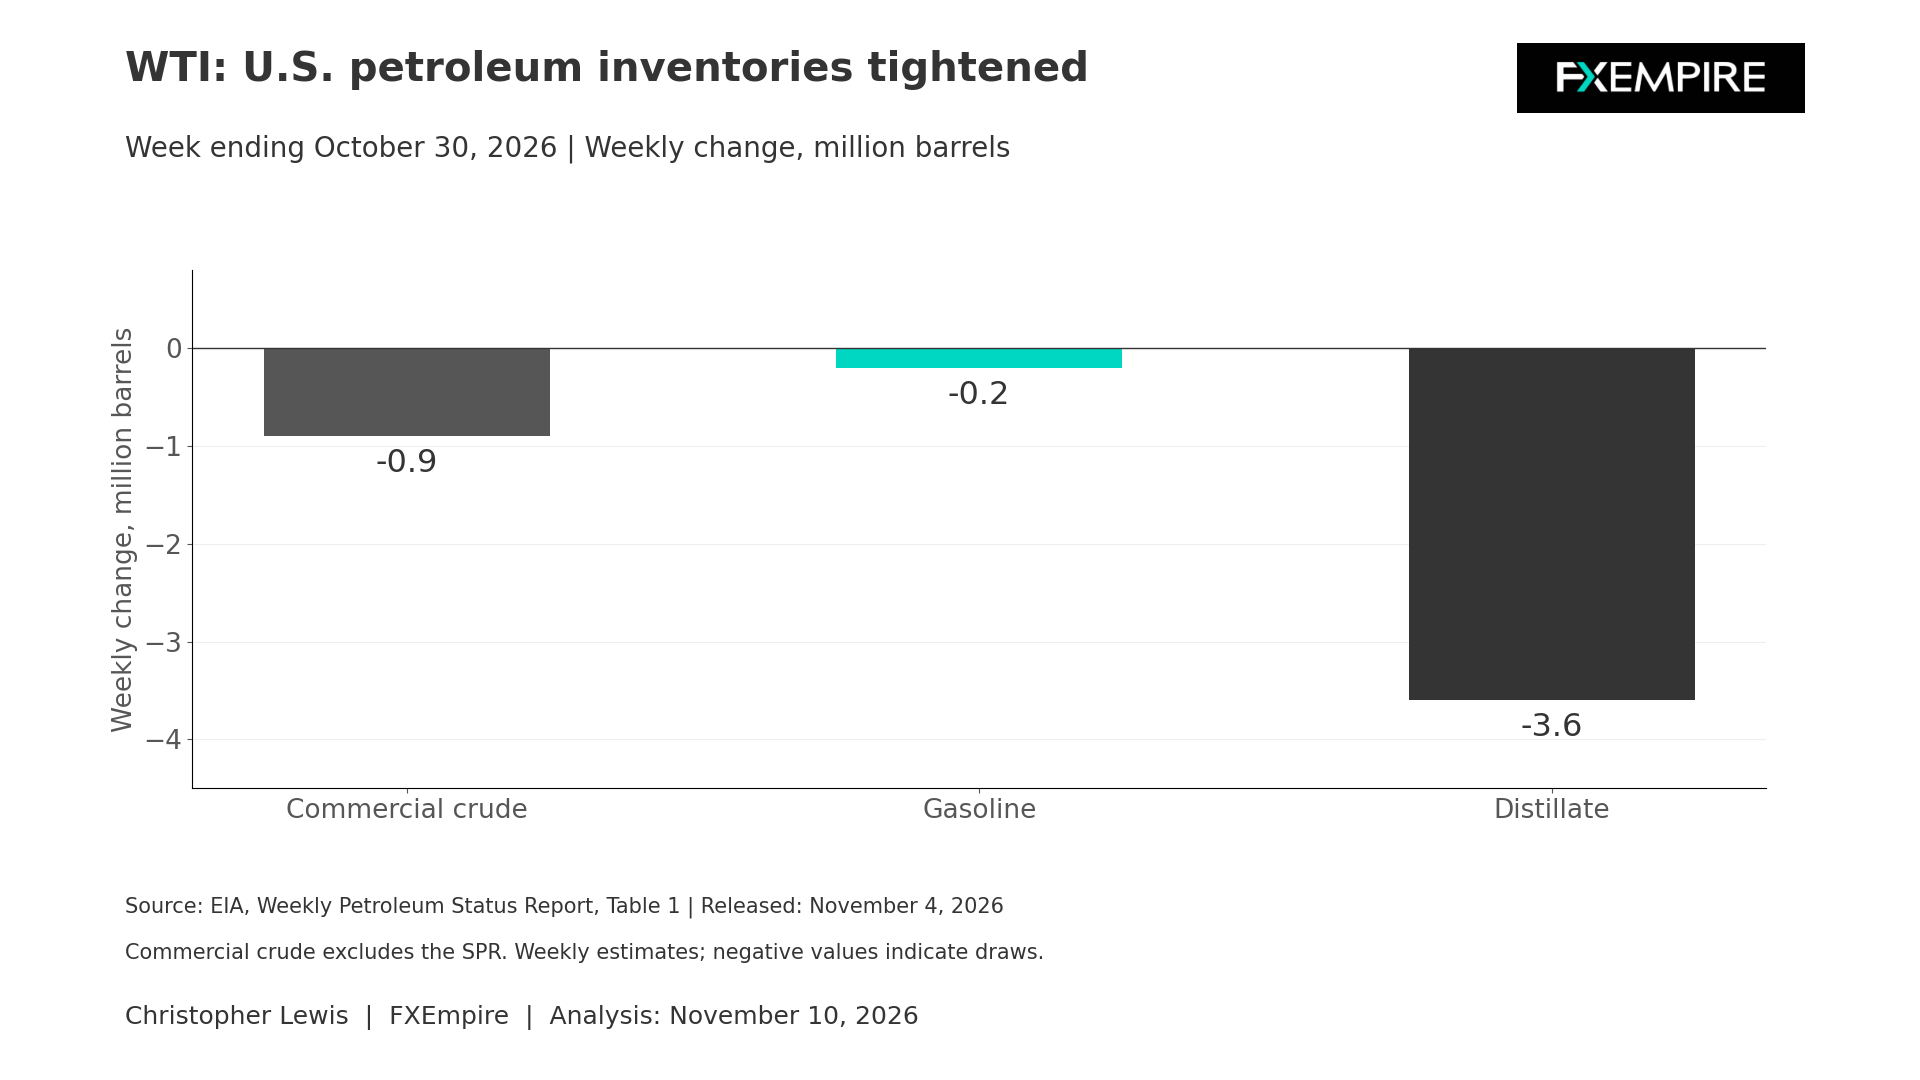
WTI crude oil begins the Tuesday session with a tighter set of petroleum balances in the United States, although the latest official figures are estimates for the week ending October 30, rather than real-time measures. The EIA Weekly Petroleum Status Report, released on November 4, showed commercial crude stocks at 409.8 million barrels, down 900,000 on the week. The Strategic Petroleum Reserve also declined by 400,000 barrels to 282.2 million.
These draws are supportive at the margin, but the more consequential development, as far as crude oil is concerned, is actually in the refined products category. Gasoline stocks slipped 200,000 barrels to 209 million, while distillate inventories fell 3.6 million to reach 99.3 million. Distillate stocks were 11% below the levels they had hit the previous year.
Flow Data Presents a Bit More of a Complicated Picture
Crude production was estimated at 14.003 million barrels per day, up 11,000 barrels per day from the previous week. Refinery crude inputs increased by 199,000 barrels per day to 16.725 million, helping explain why crude inventories fell even as production remained high. Simply put, refineries are trying to catch up from some of the slowdown that we had seen during the hurricane a few weeks ago.
Crude Exports
Crude exports dropped by 1.17 million barrels per day to 3.675 million, while imports were broadly unchanged at 6.374 million. Petroleum products supplied rose to 21.962 million barrels per day, and its four-week average was 4.2% above a year earlier. Gasoline supplied increased to 8.808 million barrels per day, and distillate supplied reached 4.439 million.
These are demand proxies coming out of the EIA, not direct consumption, and this volatile week should not be treated as a durable trend. But still, the low distillate stock level gives the U.S. market less room to absorb a cold-weather demand surge or a refinery outage.
EIA Report
The next WTI catalyst is delayed by Wednesday’s Veterans Day holiday. The EIA report for the week ending November 6 is going to be released on Thursday, November 12, at noon ET. Until then, traders will have to sort out whether stronger refinery throughput can continue without rebuilding crude stocks.
WTI Crude Oil Price Forecast
Every new WTI Crude Oil analysis as it publishes, today's technical signal and key levels, live price — on one page.
See all WTI Crude Oil forecastsTechnical Analysis
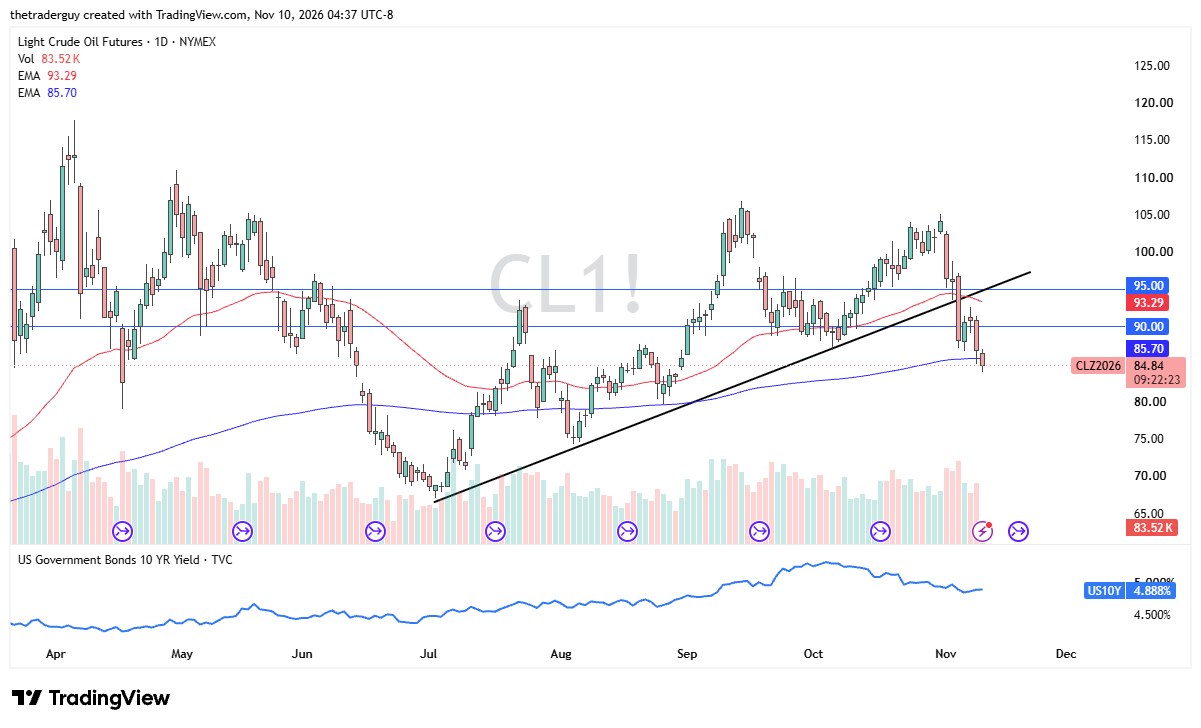
From a technical analysis standpoint, it is interesting that we are testing the 200-day EMA after a significant sell-off. The question now is: is this sell-off going to be real? I suspect a bounce is probably in the works, and I’ll be looking to buy any type of upward momentum. That being said, I’ve yet to see it.
Brent Crude Oil
Brent’s story remains focused on international supply routes and the uneven recovery in Middle Eastern exports. The International Energy Agency’s October Oil Market Report, published on October 14, estimated that Gulf crude exports surged by 4.4 million barrels per day in September to 13.9 million, more than 75% of their pre-war levels. Total flows through the Strait of Hormuz rose to 10.9 million barrels per day, while bypass exports climbed to 5.6 million.
This shows a substantial crude recovery, but these figures also describe September conditions and can be disrupted at any moment. The recovery in refined products was quite a bit weaker, though. The IEA estimated Middle Eastern refined product exports at 1.9 million barrels per day in September, versus a 4.7 million-barrel pre-war level. LPG shipments were 670,000 barrels per day against 1.5 million previously.
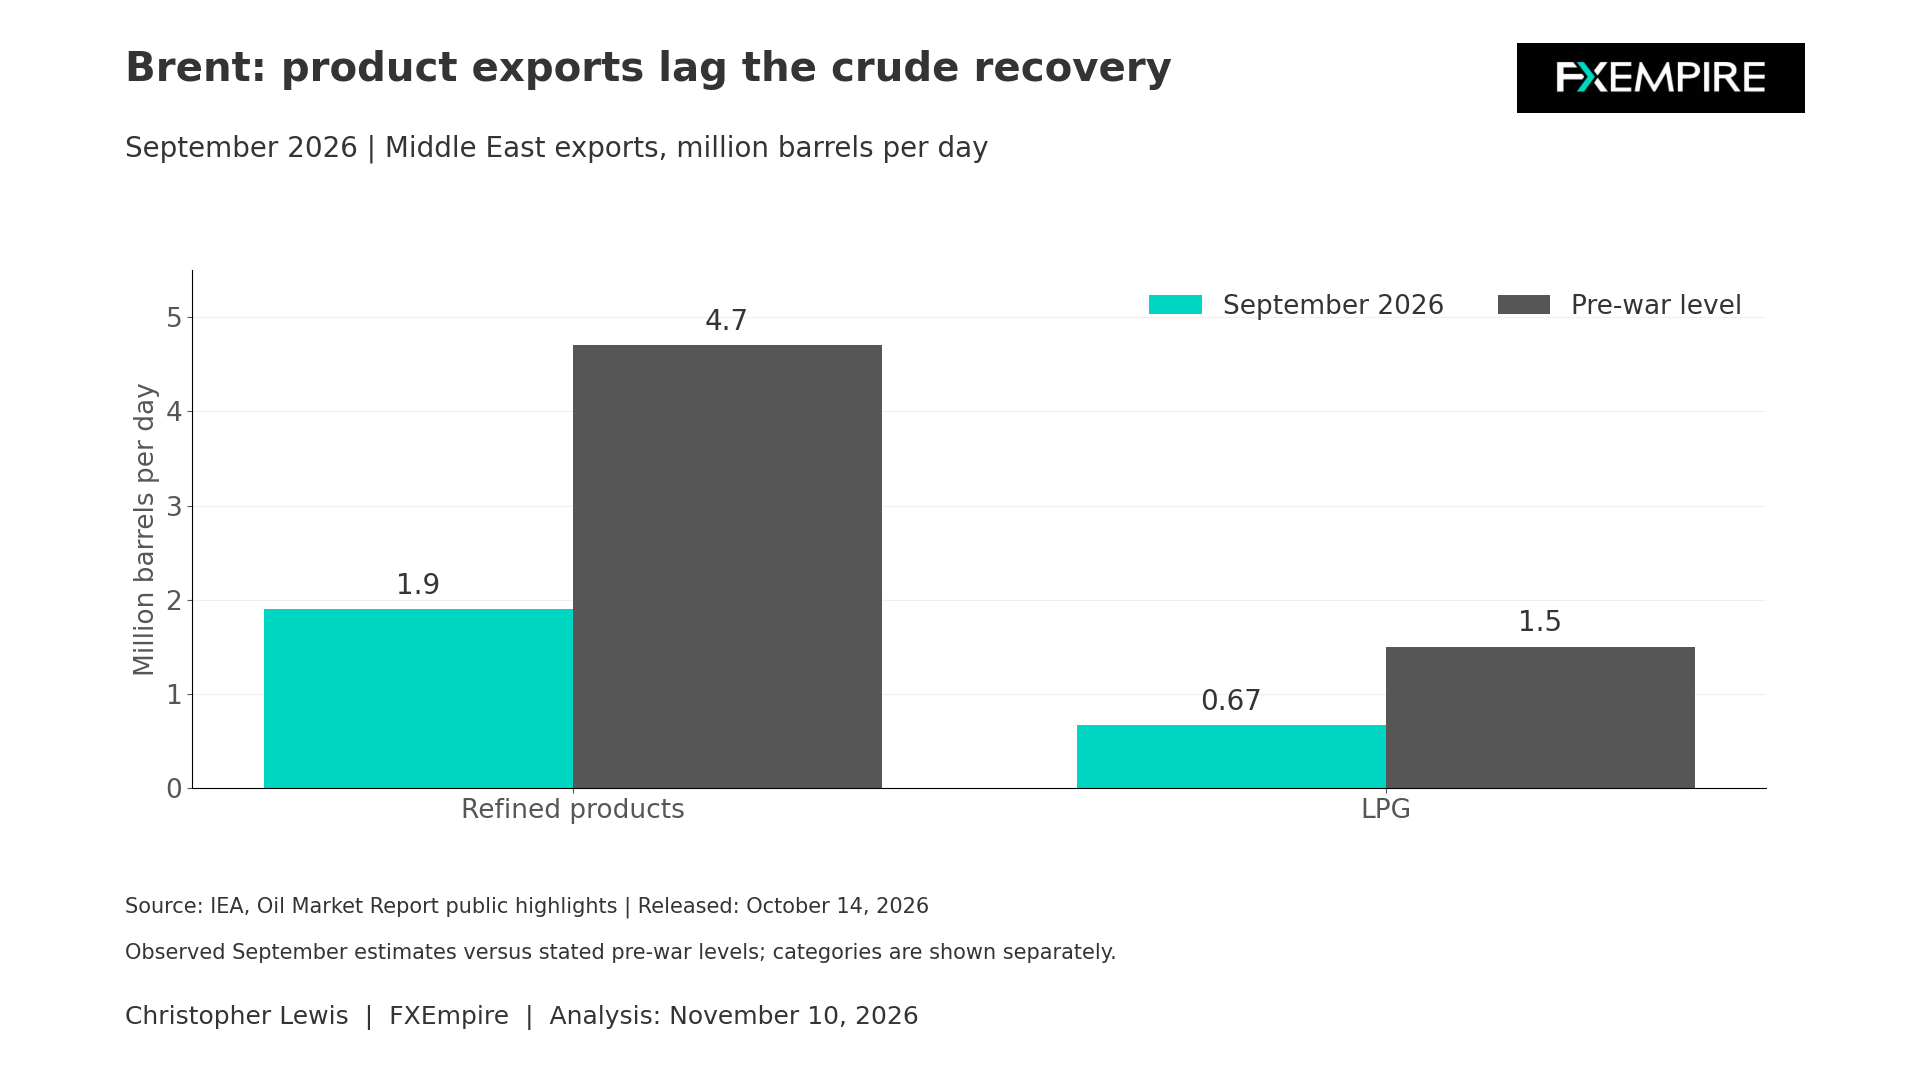
This gap will matter for Brent because a market can have more crude available while still facing shortages of diesel and other products. Restricted product availability can keep refinery margins, freight costs, and delivered fuel prices elevated.
IEA Oil Stock Report
The IEA estimated global observed oil stocks fell by 10 million barrels in September. A 103 million-barrel increase in oil on water was more than offset by a 113 million-barrel decline in on-land inventories. It forecast global demand to fall to 2.5 million barrels per day year-over-year in the fourth quarter and 2.6 million on average for the year, to 102.4 million barrels per day.
OPEC
OPEC stated on November 1 that seven participating countries would maintain their September required production levels for December. That is a policy requirement, not proof of delivered barrels, but it is good news for the oil market. The next formal OPEC+ meeting is November 29.
The Charts for Brent
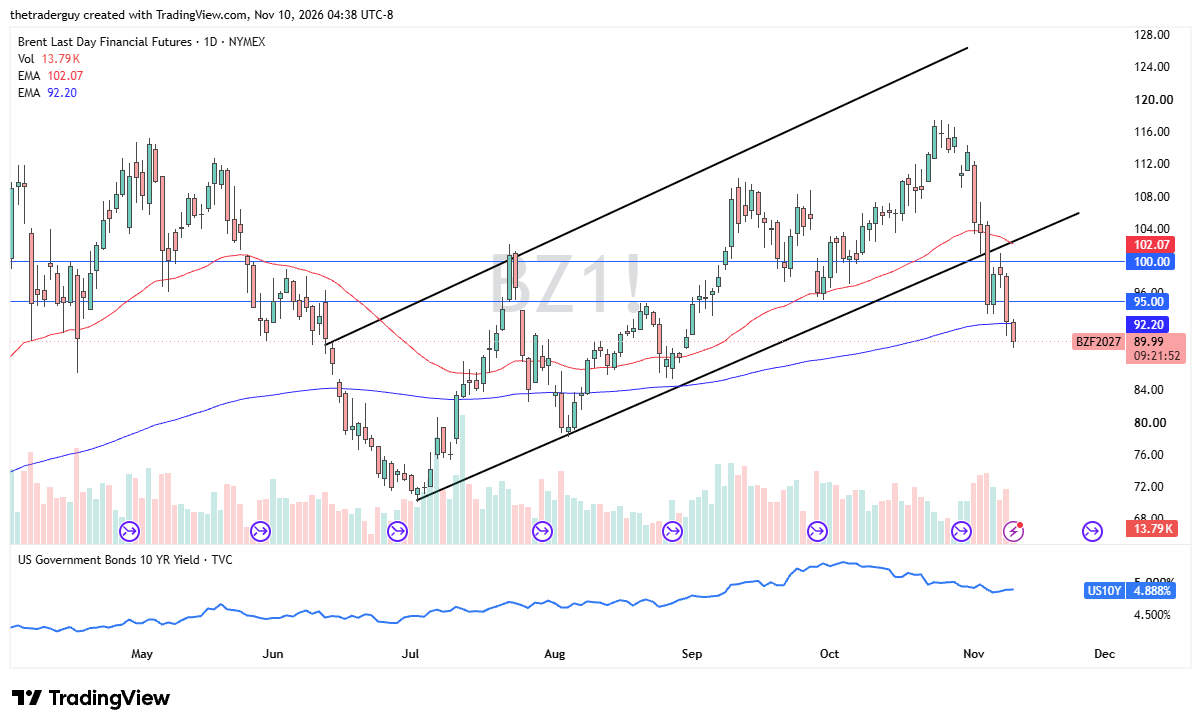
For Brent, the questions will be whether regional crude flows remain resilient, whether product exports recover, and whether freight and infrastructure risks ease. From a technical analysis standpoint, Brent does look weaker than WTI, and we’ll see whether we get a bounce here. This type of sell-off has been seen a couple of times in the past, only to be turned around on signs of disruption or conflict.
As things stand right now, the Middle East seems fairly quiet, and that is suppressing price. A move above $95 would signal another round of bullish FOMO.